2.2 Theory of fuzzy logic
As you know, the theory of fuzzy sets was developed in the sixties of the last century. And its first foundations were presented in scientific journals and scientific articles. The theory of fuzzy logic or it is also commonly called the theory of fuzzy sets is a kind of new approach to the description of business processes. It is worth noting that this approach is used when there is some uncertainty that makes it difficult or precludes the use of the most accurate quantitative methods and approaches.
Let's look at the main differences of this method. In the theory of fuzzy sets, linguistic variables have been used, that is, those variables that are difficult to describe using mathematical terms. In other words, this is when a particular indicator is difficult to imagine in the form of an exact quantitative value. As an example, we can consider such concepts as «small» and «medium». This can be applied to small and medium-sized businesses. Either the term «high» or «low», in this example we can consider the indicator of the interest rate. Note that these indicators do not have a clear boundary and therefore cannot be represented by an exact mathematical description. In the above examples, a variable whose values are words or sentences [21–26] is accepted as a linguistic variable.
When the question arises: what is the interest rate on the loan is low, several possible answers. For example, you can assume that an interest rate of less than seven percent is low, eight to fifteen is average, and above sixteen is high. As you can see from the example, the boundaries between these representations are fuzzy, blurred.
To the main tool of the method under consideration is the membership function, which is a tool for translating linguistic variables into a mathematical term, which is used for further use of the fuzzy set method.
Figure 2.5 shows the membership function for the variable «high interest rate». The X-axis shows the interest rate values, and the Y-axis shows the values of the membership function «high interest». On the graph, a value of 1 corresponds to the adopted 16 % and higher, as was adopted above this is a high interest rate. A value of 0 corresponds to a low interest rate, that is, it is below 7 %. In the figure, the membership function ![]() is a certain mathematical function that determines the degree or certainty with which the elements of a set
is a certain mathematical function that determines the degree or certainty with which the elements of a set ![]() belong to a given fuzzy set A. The more the argument X corresponds to the fuzzy set A, the larger the value
belong to a given fuzzy set A. The more the argument X corresponds to the fuzzy set A, the larger the value ![]() , that is, the closer the value of the argument to one.
, that is, the closer the value of the argument to one.
Figure 2.5 – Membership function for the variable «high interest rate
To date, there are different types of membership functions. The main types of membership functions include: triangular, trapezoidal, piecewise linear, Gaussian distribution, sigmoid. There are two groups of construction methods according to expert estimates of membership functions of a fuzzy set ![]() , these are direct and indirect methods [27].
, these are direct and indirect methods [27].
It is worth noting that a fuzzy set is a certain set that contains a collection of elements of arbitrary magnitude. If the processes are too complicated for analysis and if the application of generally accepted quantitative methods is complicated, for example, when the data are inaccurate and have uncertainty, then the use of fuzzy control is most acceptable. In systems using fuzzy logic, it is possible to solve problems with decision making, pattern recognition, classification, and so on.
It is known that when applying direct methods, the expert directly sets the rules for determining the values of the membership function ![]() that characterize a given element x. For example, representing a membership function by a table, graph, or mathematical relationship. The negative qualities of this group of methods include a large share of subjectivity.
that characterize a given element x. For example, representing a membership function by a table, graph, or mathematical relationship. The negative qualities of this group of methods include a large share of subjectivity.
As for indirect methods, then the values of the membership function are chosen so as to satisfy pre-defined conditions.
This group of methods includes: the construction of membership functions based on pairwise comparisons, using statistical data, based on rank ratings, etc.
It is worth noting that fuzzy logic is a generalization of ordinary Boolean logic, which has found application in digital circuit design. Fuzzy forecasting methods only mimic the arguments and judgments of experts, that is, they are not intended to determine the exact mathematical model.
Based on the analysis of scientists' work, it is possible to identify the main properties that fuzzy sets should possess: this is normality, this is unimodality and convexity [28].
Today, a fairly wide selection of various programs is known where fuzzy logic is used. One such software product is MATLAB. To create a forecasting model based on fuzzy logic, the software product MATLAB was selected. This is due to the availability of experience in MATLAB and its availability, as well as the great computing capabilities of this software package.
When scientists talk about fuzzy logic, they mean fuzzy inference systems. These systems are the basis of various expert and management processes. Here are the main stages of fuzzy inference: the formation of a base of rules for a fuzzy inference system; fuzzification of input parameters; aggregation; activation of subconditions in fuzzy production rules and defuzzification [29].
Figure 2.6 shows the main stages of fuzzy inference [30].
Consider all of these steps. The first is the formation of a fuzzy inference system rule base. This stage is one of the key stages, since the accuracy of the final result depends on what rules are applied. The process of forming the base of rules for fuzzy inference is a formal representation of the empirical knowledge of an expert. The final result depends on the knowledge and experience of the expert.
Often, the rule base takes the form of structured text: Rule_1: If «Condition_A1» or «Condition_B1» THEN «Effect_C1».
Rule_2: If «Condition_A2» or «Condition_B2» THEN «Consequence_C2»... Rule_n: If «Condition_An» or «Condition_Bn» THEN «Effect_Cn», where «Condition_A1», «Condition_A2», ..., «Condition_An» and «Condition_B1», «Condition_B2», ..., «Condition_Bn» are the input linguistic variables, «Corollary_C1», «Corollary_C2», ..., «Corollary_Cn» are the output linguistic variables.
Input and output linguistic variables are considered defined if membership functions are defined for them. Figure 2.6 shows the stage of formation of 3 groups of rules, where membership functions are defined for each variable.
The next step is fuzzification of input parameters. The word fuzzification should be understood as the process of finding the membership function of fuzzy sets based on ordinary source data.
Here a correspondence is established between the numerical value of the input variable and the corresponding linguistic variable.
According to the example in Figure 2.6, input variable A is three, and variable B is eight. The accepted scale is from zero to ten, where the rating shows the «low» and «excellent» characteristics of the described parameter, respectively.
After the fuzzification step, the aggregation step follows. At this stage, it is necessary to determine the degree of truth of each of the subclauses for each of the rules of fuzzy inference systems.
Each stage is important because the quality of the result depends on the correctness of the approach. At this stage, one fuzzy set is created, which will be assigned to each output variable for each rule. Here the operations of minimum or multiplication are used.
When you activate the subconditions in the fuzzy production rules, the fuzzy subsets assigned to each output variable are combined together to form one fuzzy subset for each variable.
At the last stage of defuzzification, the obtained results of all output variables at the previous stages of fuzzy inference are converted to the usual quantitative values of each of the output variables.
![Figure 2.6 – Stages of fuzzy inference [30]](img/image014.jpg)
Figure 2.6 – Stages of fuzzy inference [30]
Defuzzification of a fuzzy set ![]() by the method of center of gravity is carried out according to the formula [26].
by the method of center of gravity is carried out according to the formula [26].
 (2.1)
(2.1)
This mathematical dependence can be represented graphically. A graphical representation of this formula is to find the center of gravity of a flat figure, which is limited by the coordinate axes and the graph of the membership function of a fuzzy set. Figure 2.7 shows an example of the result of defuzzification [28, 31].
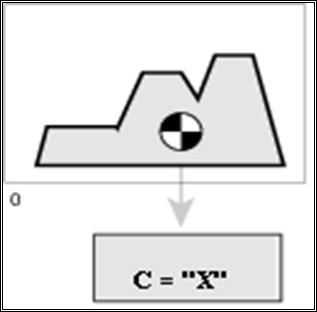
Figure 2.7 – The results of defazzification