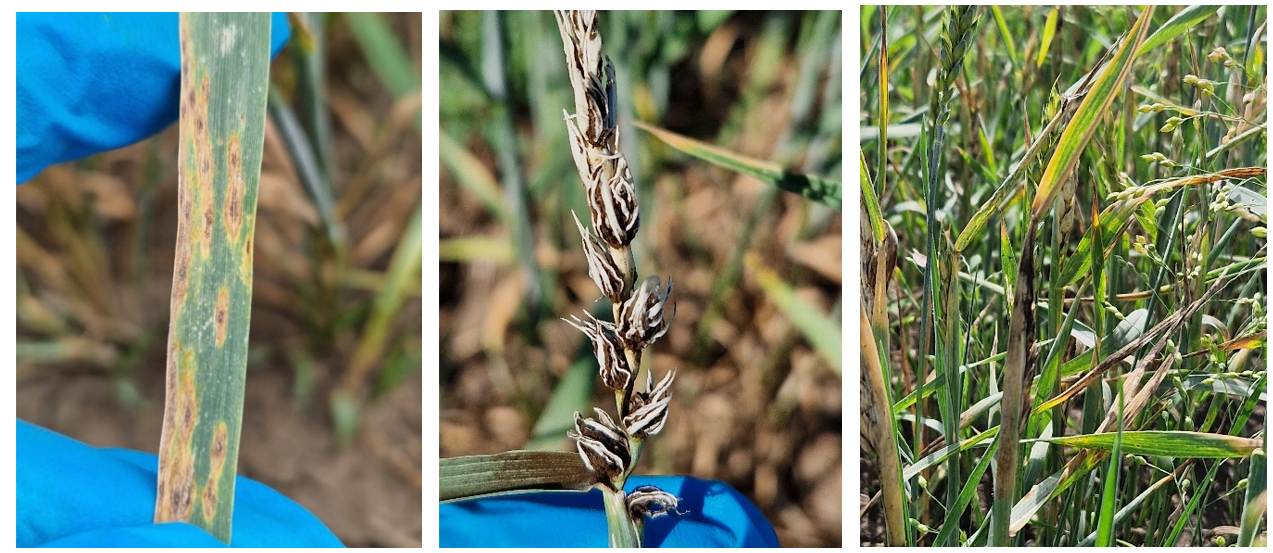
4.3 Assessing the incidence of spring wheat with airborne and foliar infections
To assess diseases with airborne or foliar infections, 10 samples of 10 stems (leaves) were taken every 25-50 steps (Figure 23). If the disease was uniformly distributed, samples were taken from any side of the field in a triangular or rectangular shape, moving 25-50 m away from the edge and going deeper into the planting area up to 200-300 m. If the disease was unevenly distributed (localised), samples were taken in a chessboard pattern or diagonally across the field [35].
 ;
;
Figure 23 - Assessing the incidence of spring wheat with phytopathogens
The incidence of spring wheat with phytopathogens was assessed according to State Standard 12044-93 "Methods for determining disease infection" [36] (Figure 24).
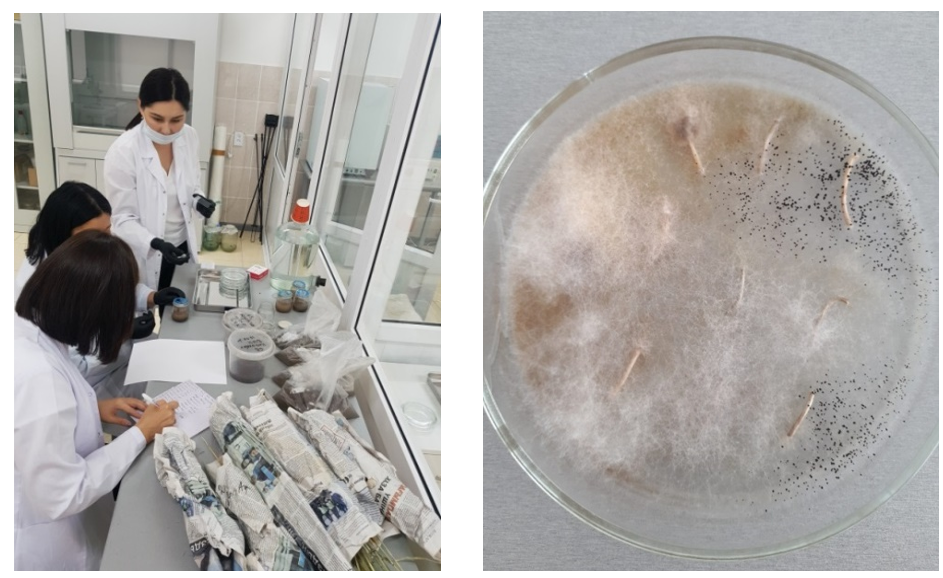
Figure 24 - Assessing phytopathogens in spring wheat
Two parameters were used to measure the phytopathological status of the crops: prevalence and degree or intensity of disease development.
Prevalence calculation formula [37]:
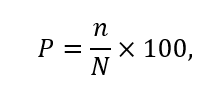
number of affected plants (organs) involved in the samples, pcs;
N – total number (diseased and healthy) plants (organs) involved in the samples, pcs.
Disease progression (R) calculation formula [37]:
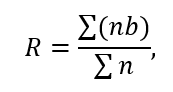
Ʃ(nb) – sum of the products of affected plants multiplied by the degree of damage;
Ʃn – total number of damaged plants or similar organs in the samples, pcs.
The severity of the damage was determined by conditional grading [37, 38].
The severity of disease development was expressed in percentages. We used the formula to convert the score to a percentage [19]:

Ʃ(nb) – sum of the products of affected plants multiplied by the disease progression score;
Ʃn – total number of damaged plants or similar organs in the samples, pcs;
А – the highest score on the chart.
The calculation formula for the biological effectiveness of fungicides [37]:

У – rate of disease progression (control);
у – indicator of disease progression in the treated area.
Laboratory tests were performed in accordance with generally accepted State Standards and methods: state of crops and crop productivity according to the phenological stages of plant development; nature of the seeds according to State Standard PO42-80; yield was recalculated for standard (14%) moisture and 100% purity; crop structure - with the method of individual analysis of plants in a sheaf [37]. Plant sampling was carried out on the days of counting. The analysis was conducted with the help of special equipment at the Biological Research Laboratory of NPJSC "Toraighyrov University". The mass of the roots and plants` underground parts was determined by using an analytical balance. Mathematical processing was conducted according to B.A. Dospekhov [39]. Variance and correlation analyses were performed on an IBMPC using the Excel program.