
1 Theoretical foundations of multispectral monitoring of agricultural crops
In crop monitoring, multispectral sensing is one of the most modern and promising technologies. Multispectral remote sensing is a method of obtaining information about a specific object without direct physical contact. The core operating principle of this method is based on recording reflected electromagnetic radiation simultaneously across several spectral bands. Crucially, this approach relies on the use of specialised cameras that capture radiation not only in the visible range but also in the infrared part of the spectrum (Figure 1) [1], which plays a significant role in containing essential information about crop conditions.
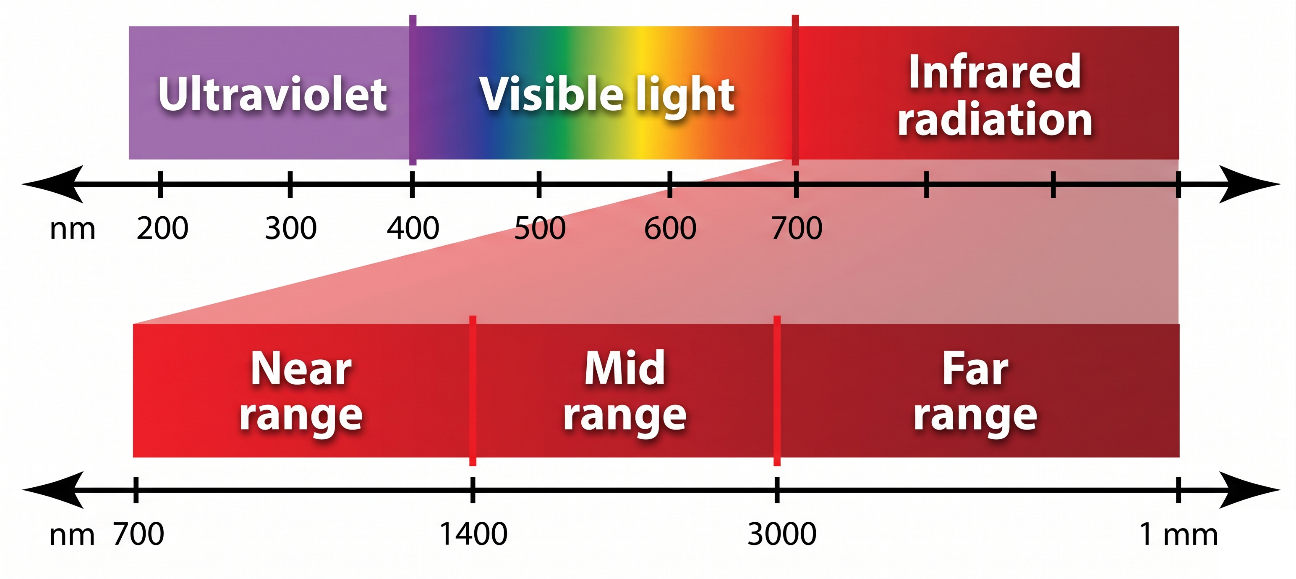
Figure 1 – Electromagnetic spectrum [1]
The human eye perceives electromagnetic radiation only within the visible range, which includes red, green, and blue channels. A distinct feature of multispectral cameras is their effective expansion of the spectral observation range compared to observations conducted using traditional methods. Primarily, this is due to the fact that these hardware devices record radiation reflectance in several discrete spectral bands, the number of which typically does not exceed ten (Figure 2) [2].
The monitoring of vegetation occupies a special position within this system. In practice, two bands are identified as having the greatest significance for vegetation analysis: the near-infrared band and the red edge region. This selection of bands for recording the spectral signal is based on the fact that healthy vegetation is generally characterised by a specific spectral response. The underlying cause is the intense absorption of red radiation by vegetation directly during photosynthesis. Concurrently, a pronounced and visually distinct reflectance of a significant portion of near-infrared radiation is most often observed, which is driven by the internal structural features of the leaf (Figure 3) [3].
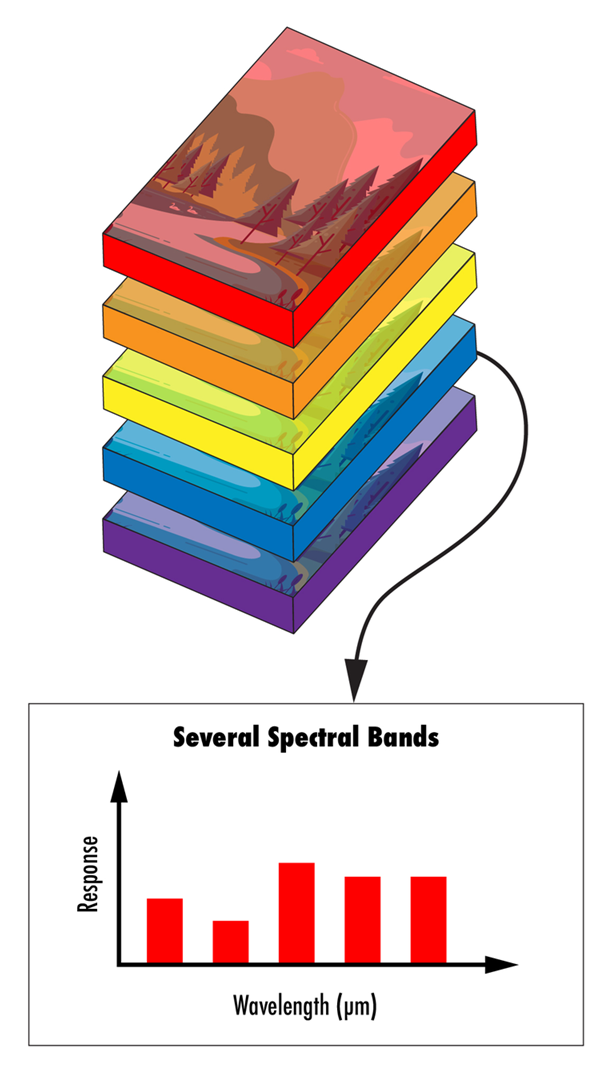
Figure 2 – Principle of multispectral image formation [2]
Multispectral data acquisition is carried out using several specialised systems. The primary sources of multispectral data are mainly satellite systems and unmanned aerial vehicles. The Sentinel-2 satellite constellation serves as a prime example of satellite systems. The type of data obtained from satellites ensures stable, regular monitoring over large-scale territories. It is also characterised by high temporal resolution; however, this is accompanied by limited spatial resolution, averaging about 10 meters per pixel. Furthermore, a specific aspect of satellite imaging is that the quality of the acquired data is highly dependent on weather and climate conditions – primarily atmospheric factors, where cloud cover often plays a critical role.
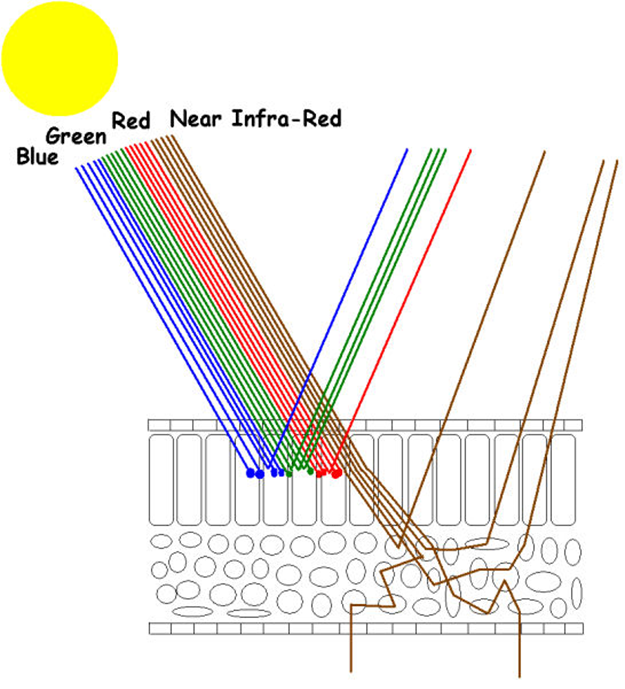
Figure 3 – Reflectance of plant tissue in the VIS-NIR range [3]
The second source of data acquisition involves unmanned aerial vehicles equipped with specialised multispectral cameras. Such unmanned systems enable comprehensive monitoring of entire fields, as well as on-demand detailed monitoring of specific field segments. This approach to studying agrocenosis conditions yields data with higher spatial resolution compared to satellite imagery. UAVs facilitate the acquisition of spectral images with resolutions reaching a few centimeters per pixel, which is significantly higher than that of satellites. Additionally, due to the low flight altitude, this approach mitigates the impact of cloud cover, thereby improving the overall quality of the acquired multispectral images.
The multispectral survey process results in the generation of raw multispectral data that possess limited interpretability; therefore, specialised mathematical transformations are applied for their analysis, forming the basis for calculating vegetation indices. A vegetation index is a quantitative indicator reflecting vegetation health, calculated based on the spectral reflectance of the observed objects across different spectral bands. One of the most common indices representing vegetation conditions is NDVI. This index is calculated using reflectance values in the red and near-infrared bands. High canopy density and healthy vegetation are generally associated with high NDVI values approaching 1 (Figure 4) [4], whereas drought, disease, and other stress factors may lead to a decline in NDVI (Figure 5) [5].
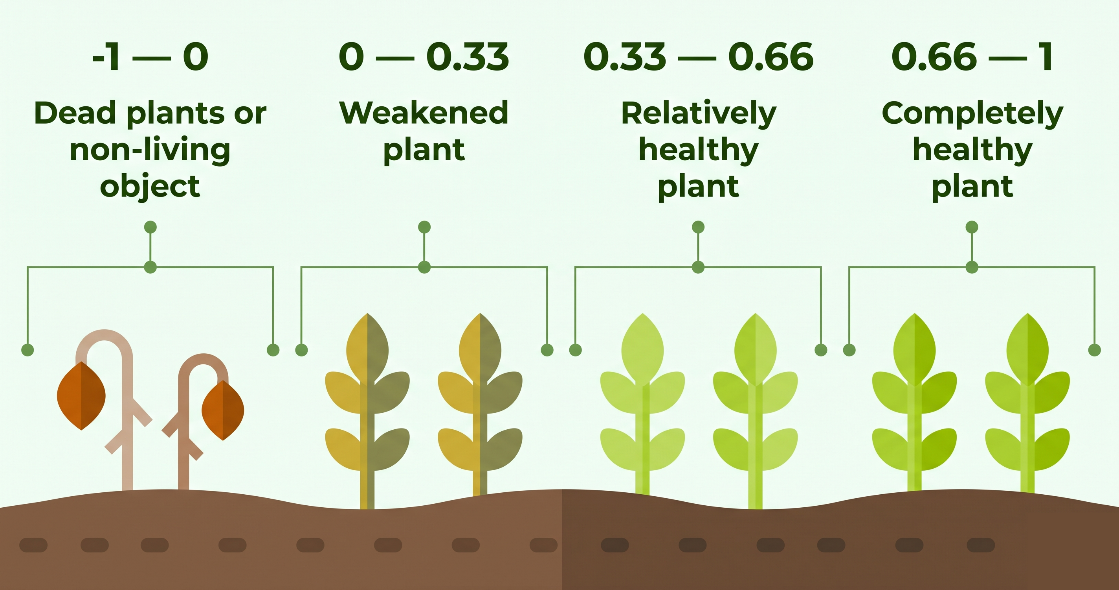
Figure 4 – Relationship between NDVI value and vegetation condition [4]
However, the NDVI index has certain limitations associated with various factors and conditions. For example, high vegetation biomass frequently causes a saturation effect, leading to a decrease in the index's sensitivity to changes in plant health. In this regard, modern research frequently utilises the NDRE index, which is based on the red edge band and exhibits heightened sensitivity to physiological changes in plants (Figure 6) [6]. This index allows for a more accurate estimation of chlorophyll content, proving particularly effective during the later stages of the growing season.
Results derived from vegetation indices are frequently used to solve a range of applied tasks. These include the processing of multispectral data and the direct calculation of the vegetation indices. Additionally, it is possible to visualise the spatial distribution of crop conditions, enabling the generation of thematic maps, the delineation of management zones based on geoanalytical data, and the identification of areas requiring further inspection. The obtained results can be used to support decision-making within precision agriculture systems.
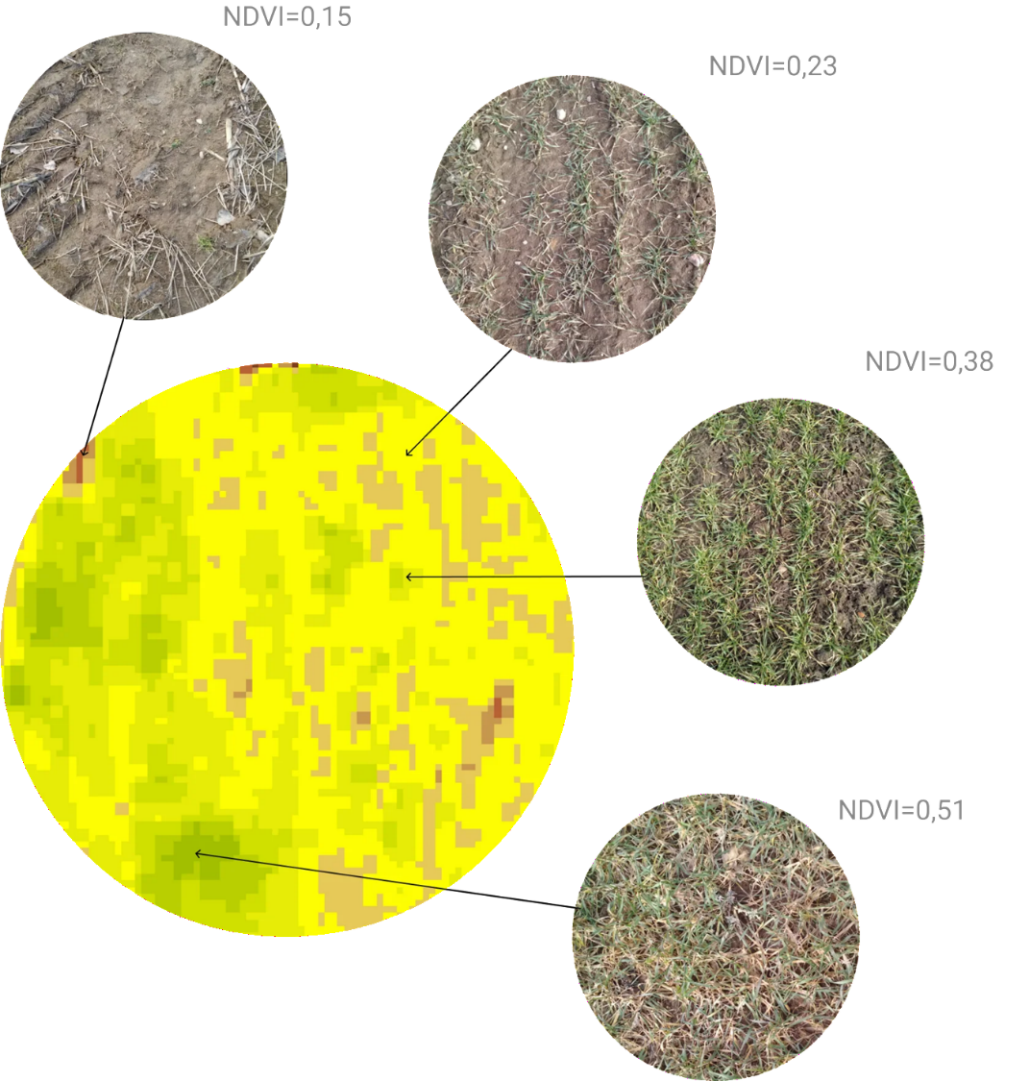
Figure 5 – Correlation between mapped NDVI values and field-observed vegetation conditions [5]
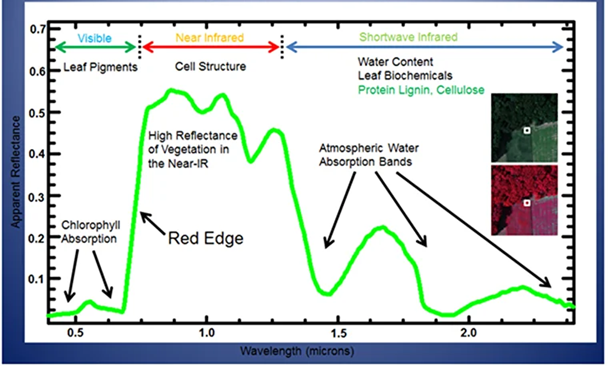
Figure 6 – Detailed vegetation canopy spectrum [6]
Overall, multispectral technologies are widely applied in the agricultural sector for the remote assessment of crop conditions, the detection of plant responses to stress factors, and the evaluation of vegetation health using spectral vegetation indices. They form an important basis for precision agriculture, supporting variable-rate applications of fertilisers, plant protection products, and irrigation water. In addition, multispectral data are used to generate field maps, delineate productivity zones, forecast crop yields, and plan agrotechnical operations according to the specific requirements of different field areas. These applications enable more targeted crop management and contribute to increased agricultural efficiency.
Therefore, multispectral monitoring plays a significant role in the development of digital and sustainable agriculture by providing reliable information for data-driven decision-making throughout the growing season. The analysis of spatial and temporal variations in crop development allows farmers to identify areas requiring specific management interventions and respond to changing field conditions in a timely manner. The integration of this technology with other digital farming tools can improve the coordination of agricultural operations, reduce unnecessary resource inputs, and minimise the environmental impact on agroecosystems. Consequently, multispectral monitoring contributes to the long-term sustainability of agricultural production while supporting the efficient use of resources and the maintenance of crop productivity.