
4.1 Importing data and preprocessing multispectral images
Working in multispectral data processing software begins with importing the captured images, configuring the processing parameters, and verifying the quality and completeness of the raw data prior to generating the orthomosaic. At this stage, it is important to ensure that the input files are correctly organised and that the necessary information is available for subsequent processing. These preliminary steps help establish the conditions for accurate image alignment and the generation of a reliable orthomosaic for further analysis.
Following an aerial survey conducted using an unmanned aerial vehicle, the acquired dataset consists of individual multispectral images containing information across several spectral bands. These data enable the assessment of vegetation health, the detection of plant stress, and the calculation of various spectral indices. However, individual images do not constitute a complete cartographic product, as each image covers only a limited area and is acquired from a particular altitude and viewing angle. Therefore, generating a unified map requires data preprocessing and photogrammetric processing. The initial stage involves importing the images, checking their quality, reading the associated metadata, identifying the relevant camera parameters, selecting the appropriate processing settings, and preparing the dataset for subsequent processing. The decisions made at this stage can significantly influence the quality of the resulting orthomosaic, making correct project configuration essential.
This study guide covers hands-on experience with the Pix4Dfields software for multispectral image processing. Upon launching the software, the home screen appears (Figure 22), displaying previously created projects and tools for organising them. The “All projects” section, located at the top of the interface (Figure 23), allows projects to be filtered or organised according to farm name, client, organisation, crop type, and crop variety. These details can be entered when creating a project. Projects can also be sorted by name and modification date (Figure 24). An adjacent question mark icon opens the “Help” and “Resources” panel (Figure 25), which provides information about the software version and licence. This panel also gives users access to technical support, the knowledge base, frequently asked questions, video tutorials, and webinars.
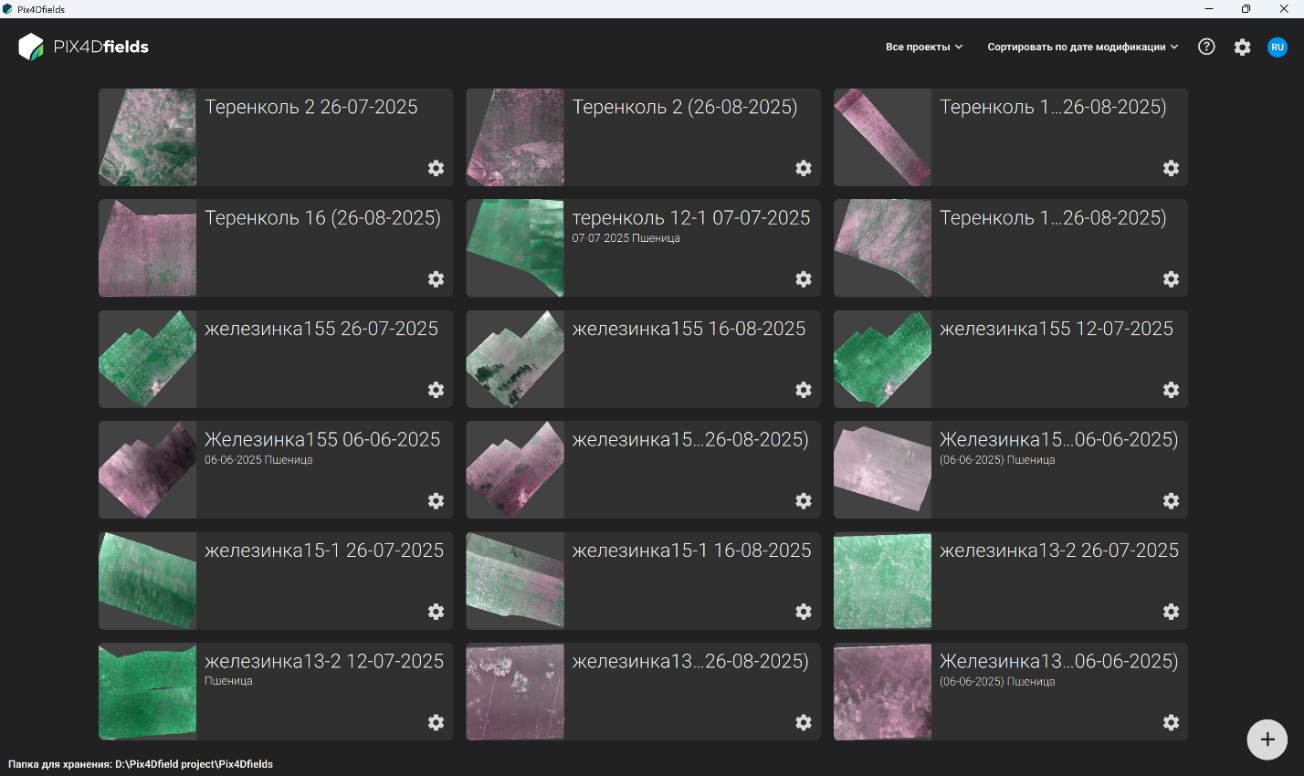
Figure 22 – Home screen of the Pix4Dfields software
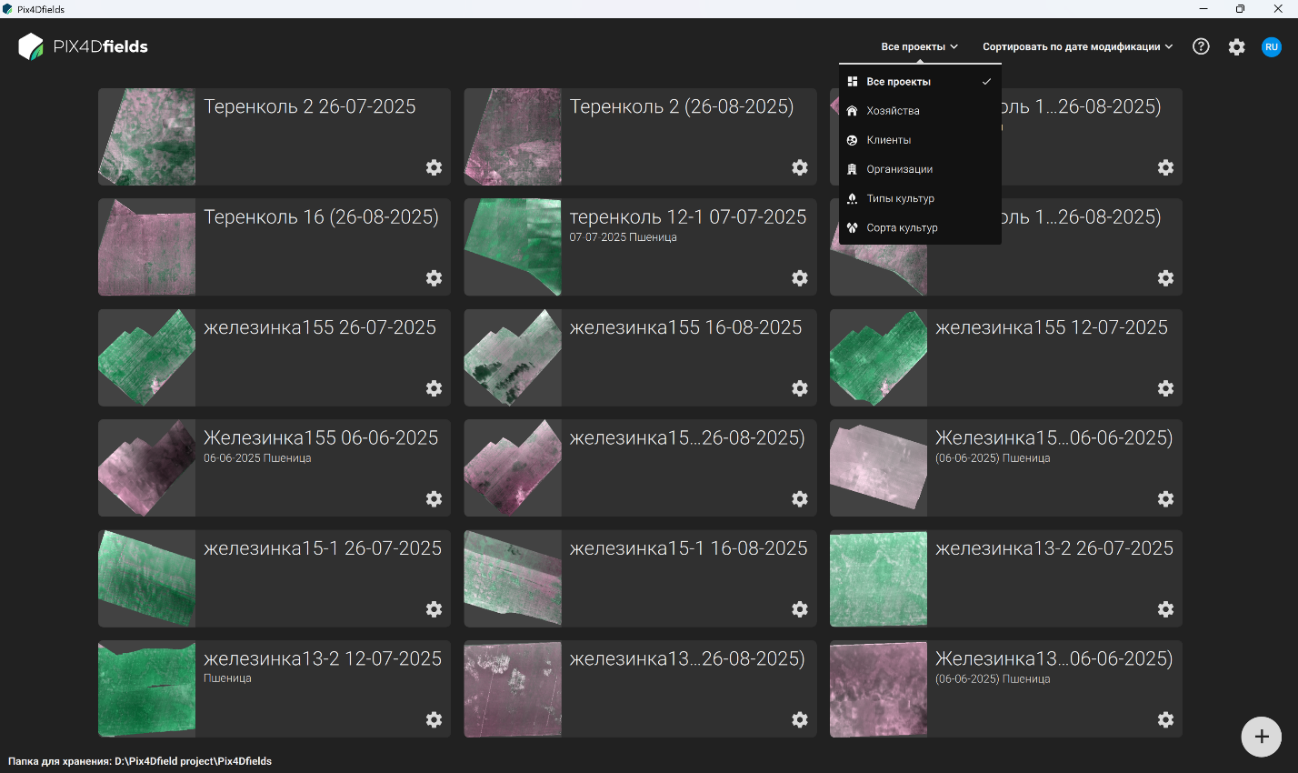
Figure 23 – Filtering projects by farm, client, organisation, crop type, and crop variety
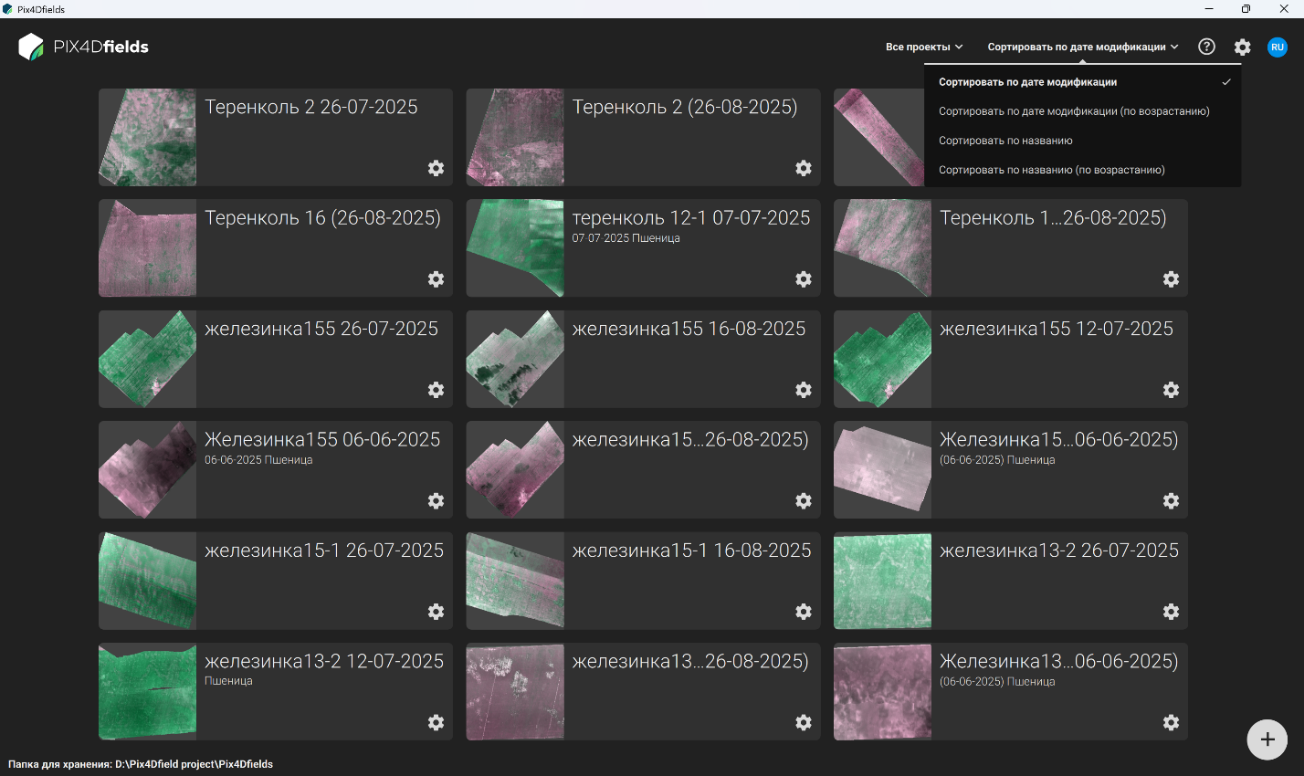
Figure 24 – Sorting projects by modification date and name
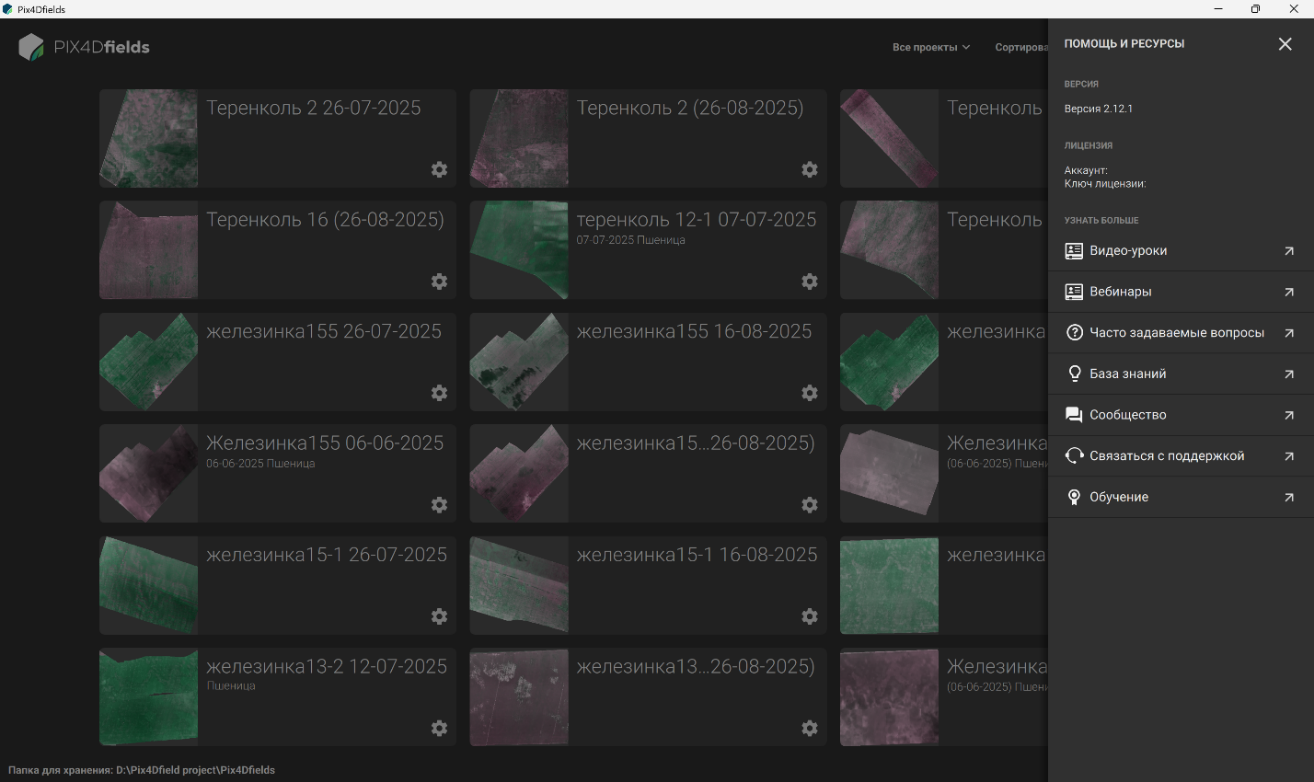
Figure 25 – “Help and Resources” sidebar
On the right-hand side of the interface, the “Settings” button provides access to the “App Settings”, “Data Processing”, and “Account” sections (Figure 26). In the мApp Settings” section, users can select the metric or imperial measurement system (Figure 27), change the interface language (Figure 28), configure the default or a custom basemap (Figure 29), and adjust the layout of PDF reports (Figure 30).
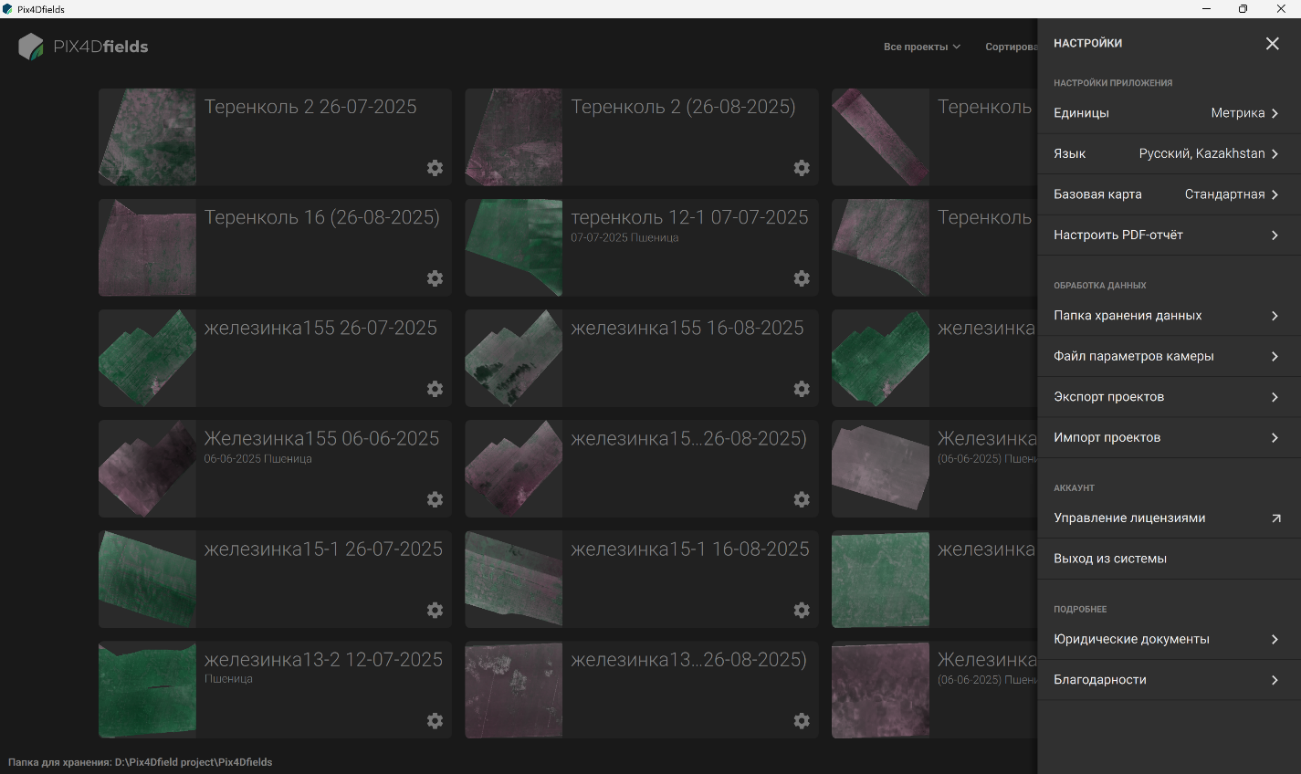
Figure 26 – Settings sidebar
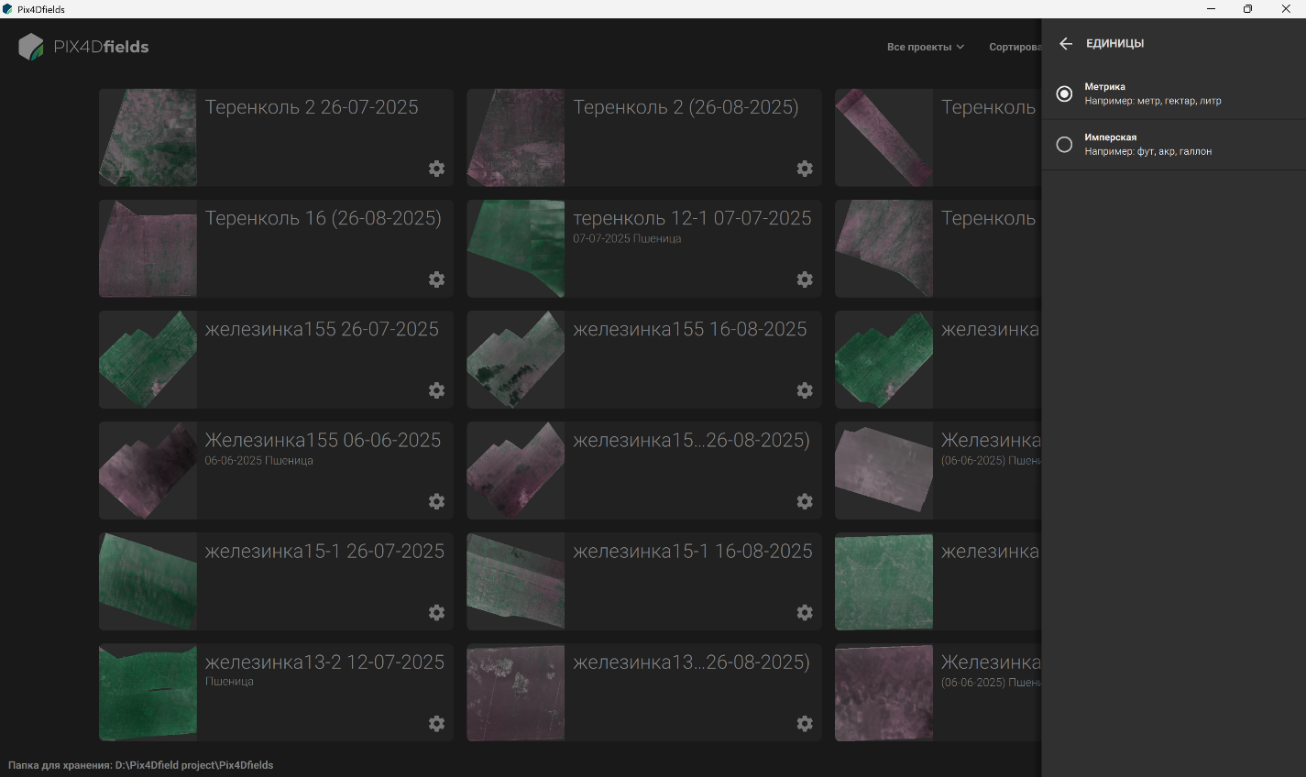
Figure 27 – Measurement units settings sidebar
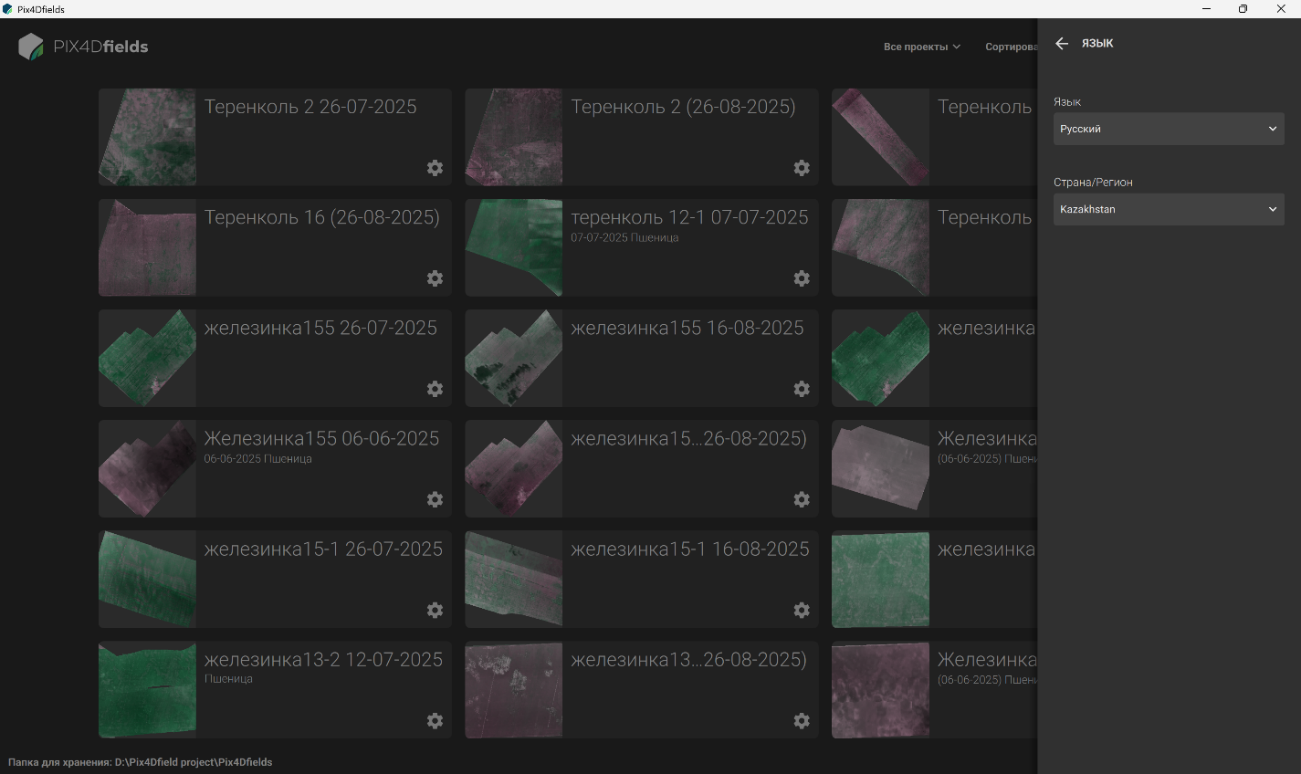
Figure 28 – Interface language settings sidebar
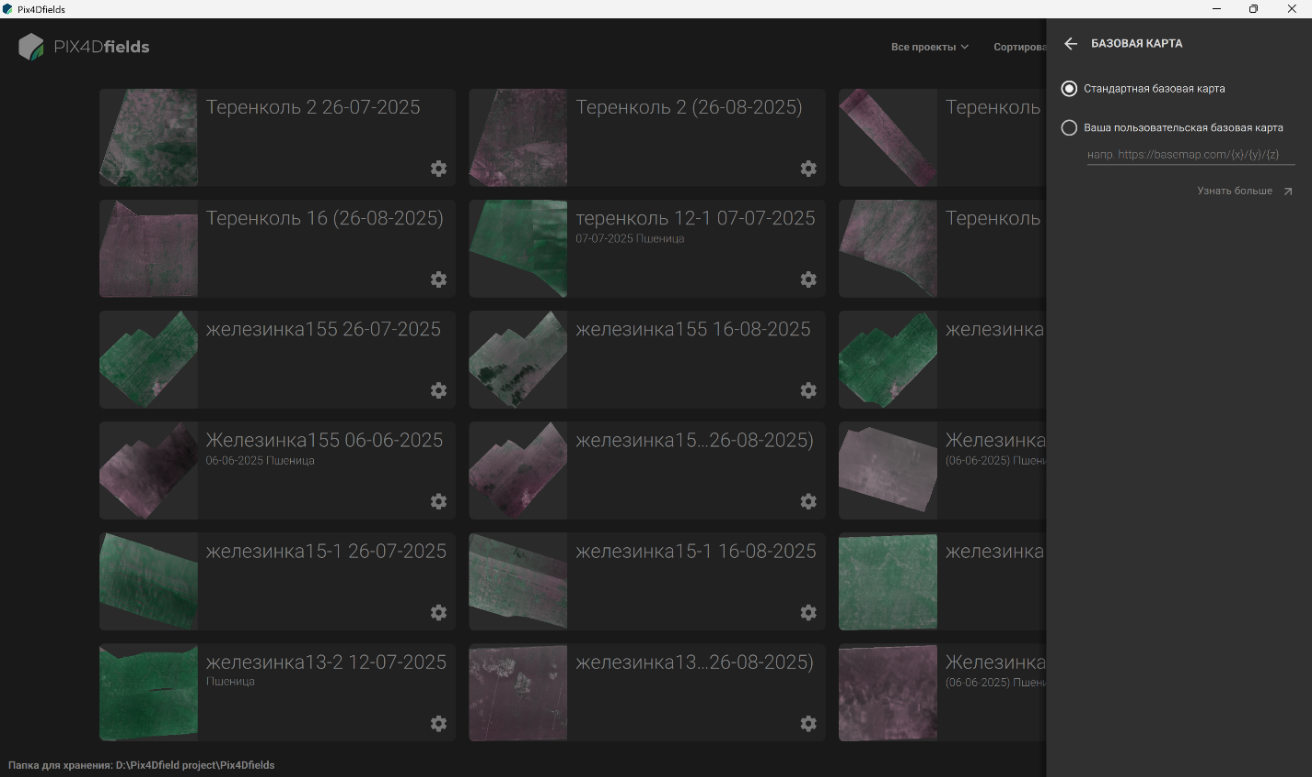
Figure 29 – Basemap settings sidebar
In the “Data Processing” section, users can specify the default folder for storing projects (Figure 31), select a camera parameters file (Figure 32), and import or export projects.
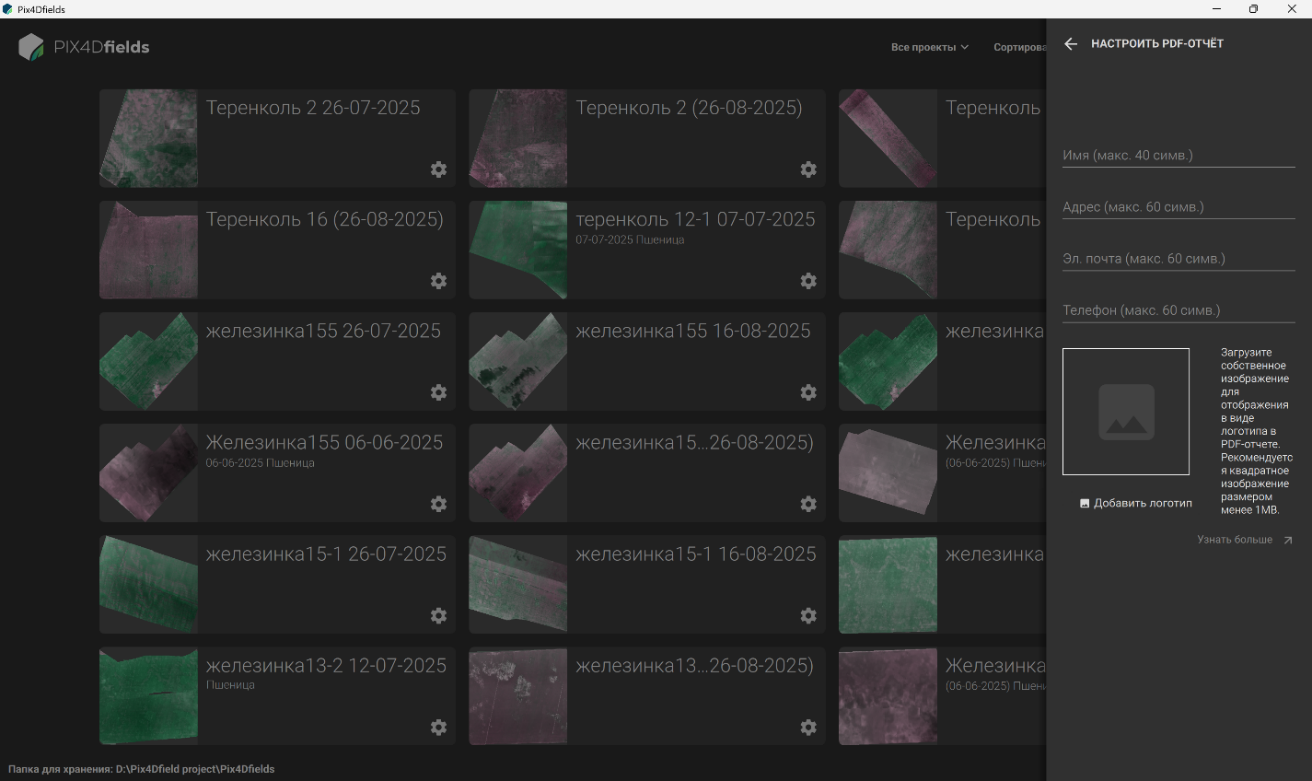
Figure 30 – PDF report layout settings sidebar
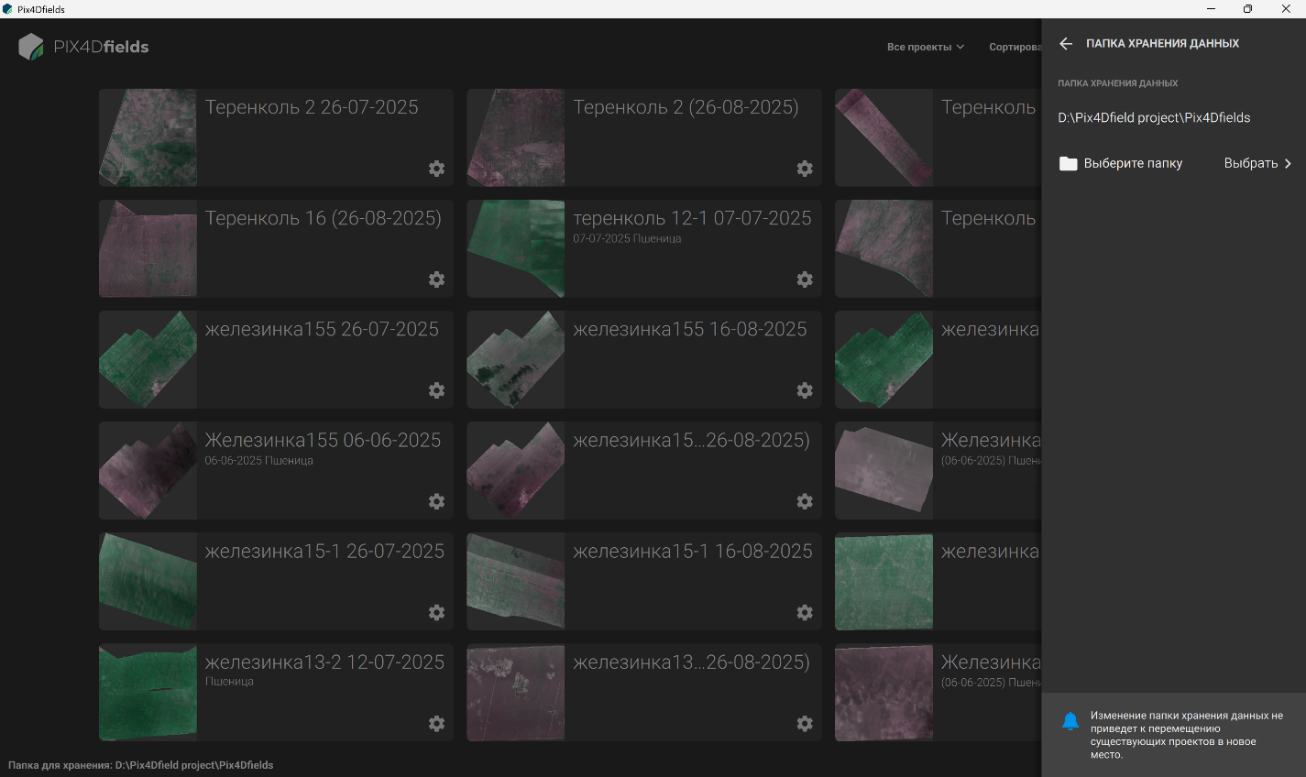
Figure 31 – Default data storage folder settings sidebar
To begin working in Pix4Dfields, a new project must be created. This can be done by selecting “New Project” on the home screen or clicking the “plus” icon in the bottom-right corner of the interface (Figure 33). A new project is then created and assigned a name (Figures 34–36). If necessary, a description can be entered in the “Description” field (Figure 37), and the project storage location can also be specified.
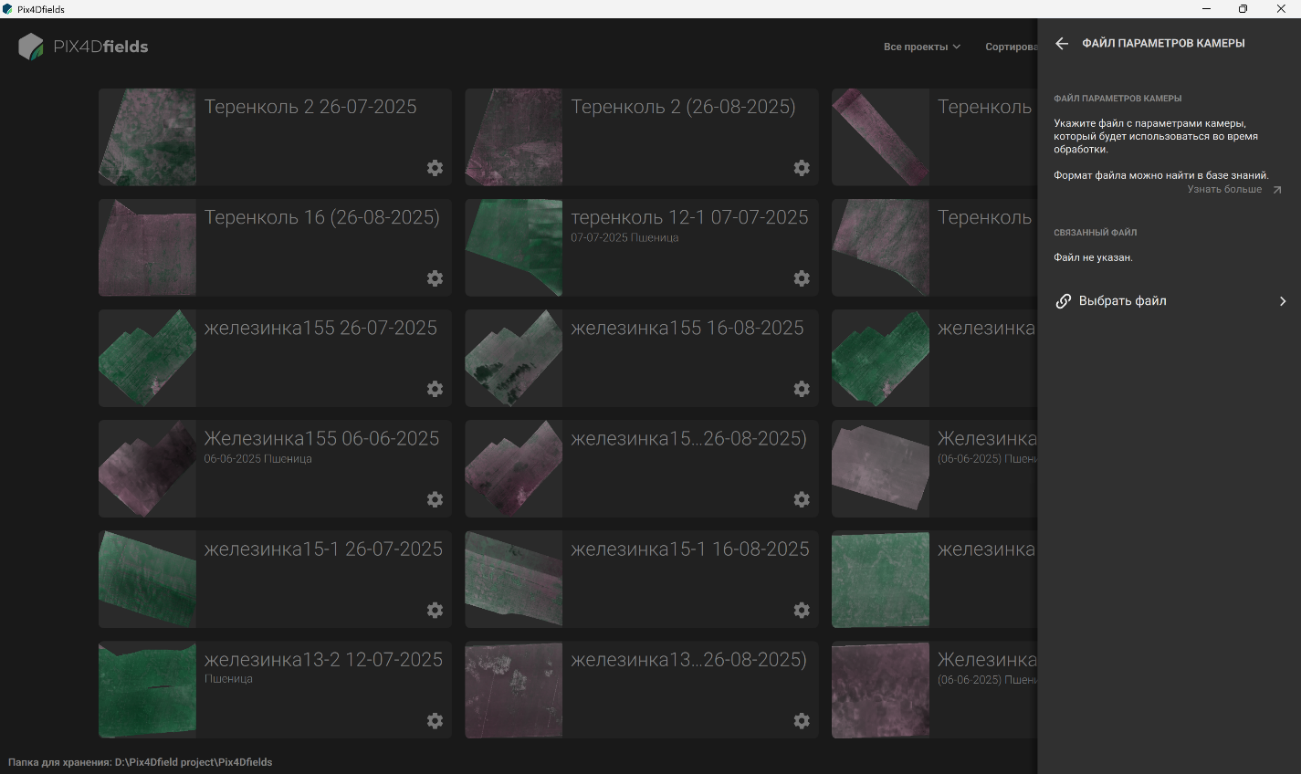
Figure 32 – Sidebar for setting and selecting the parameters of the camera used for the survey
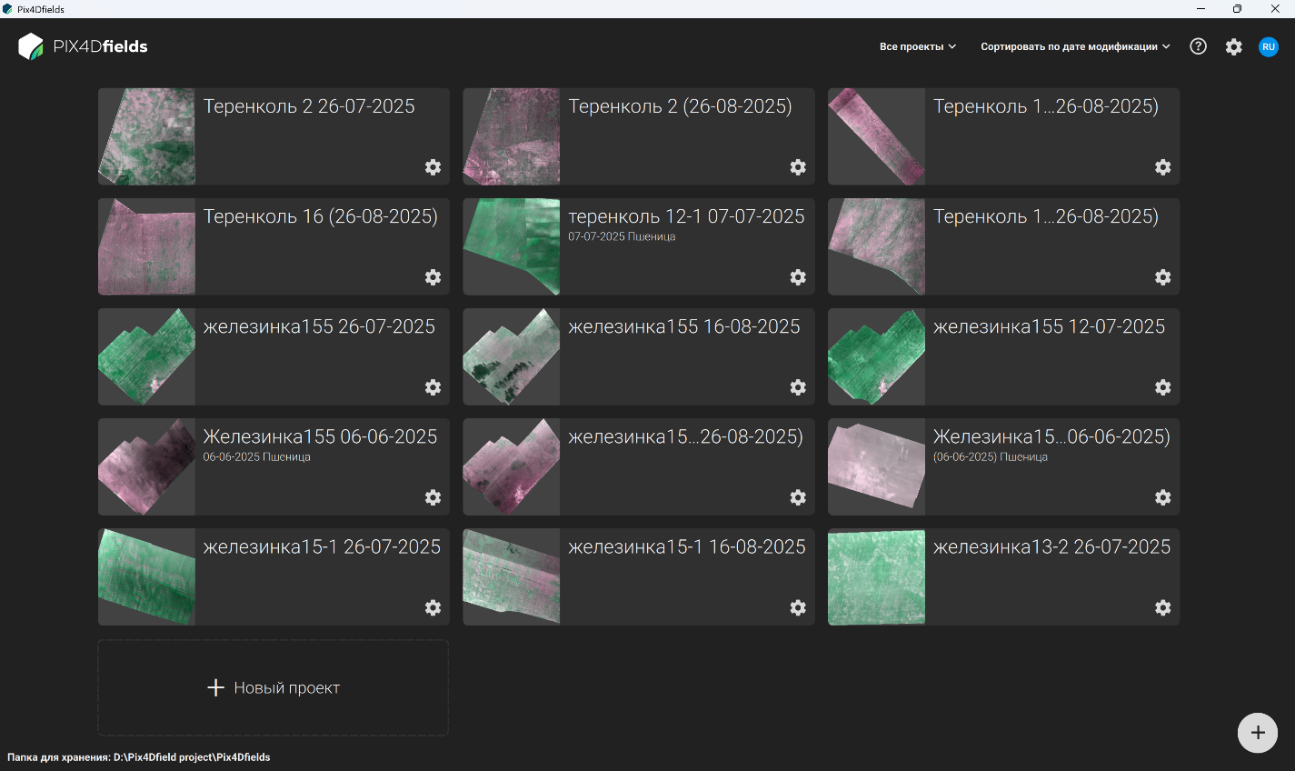
Figure 33 – Creating a new project
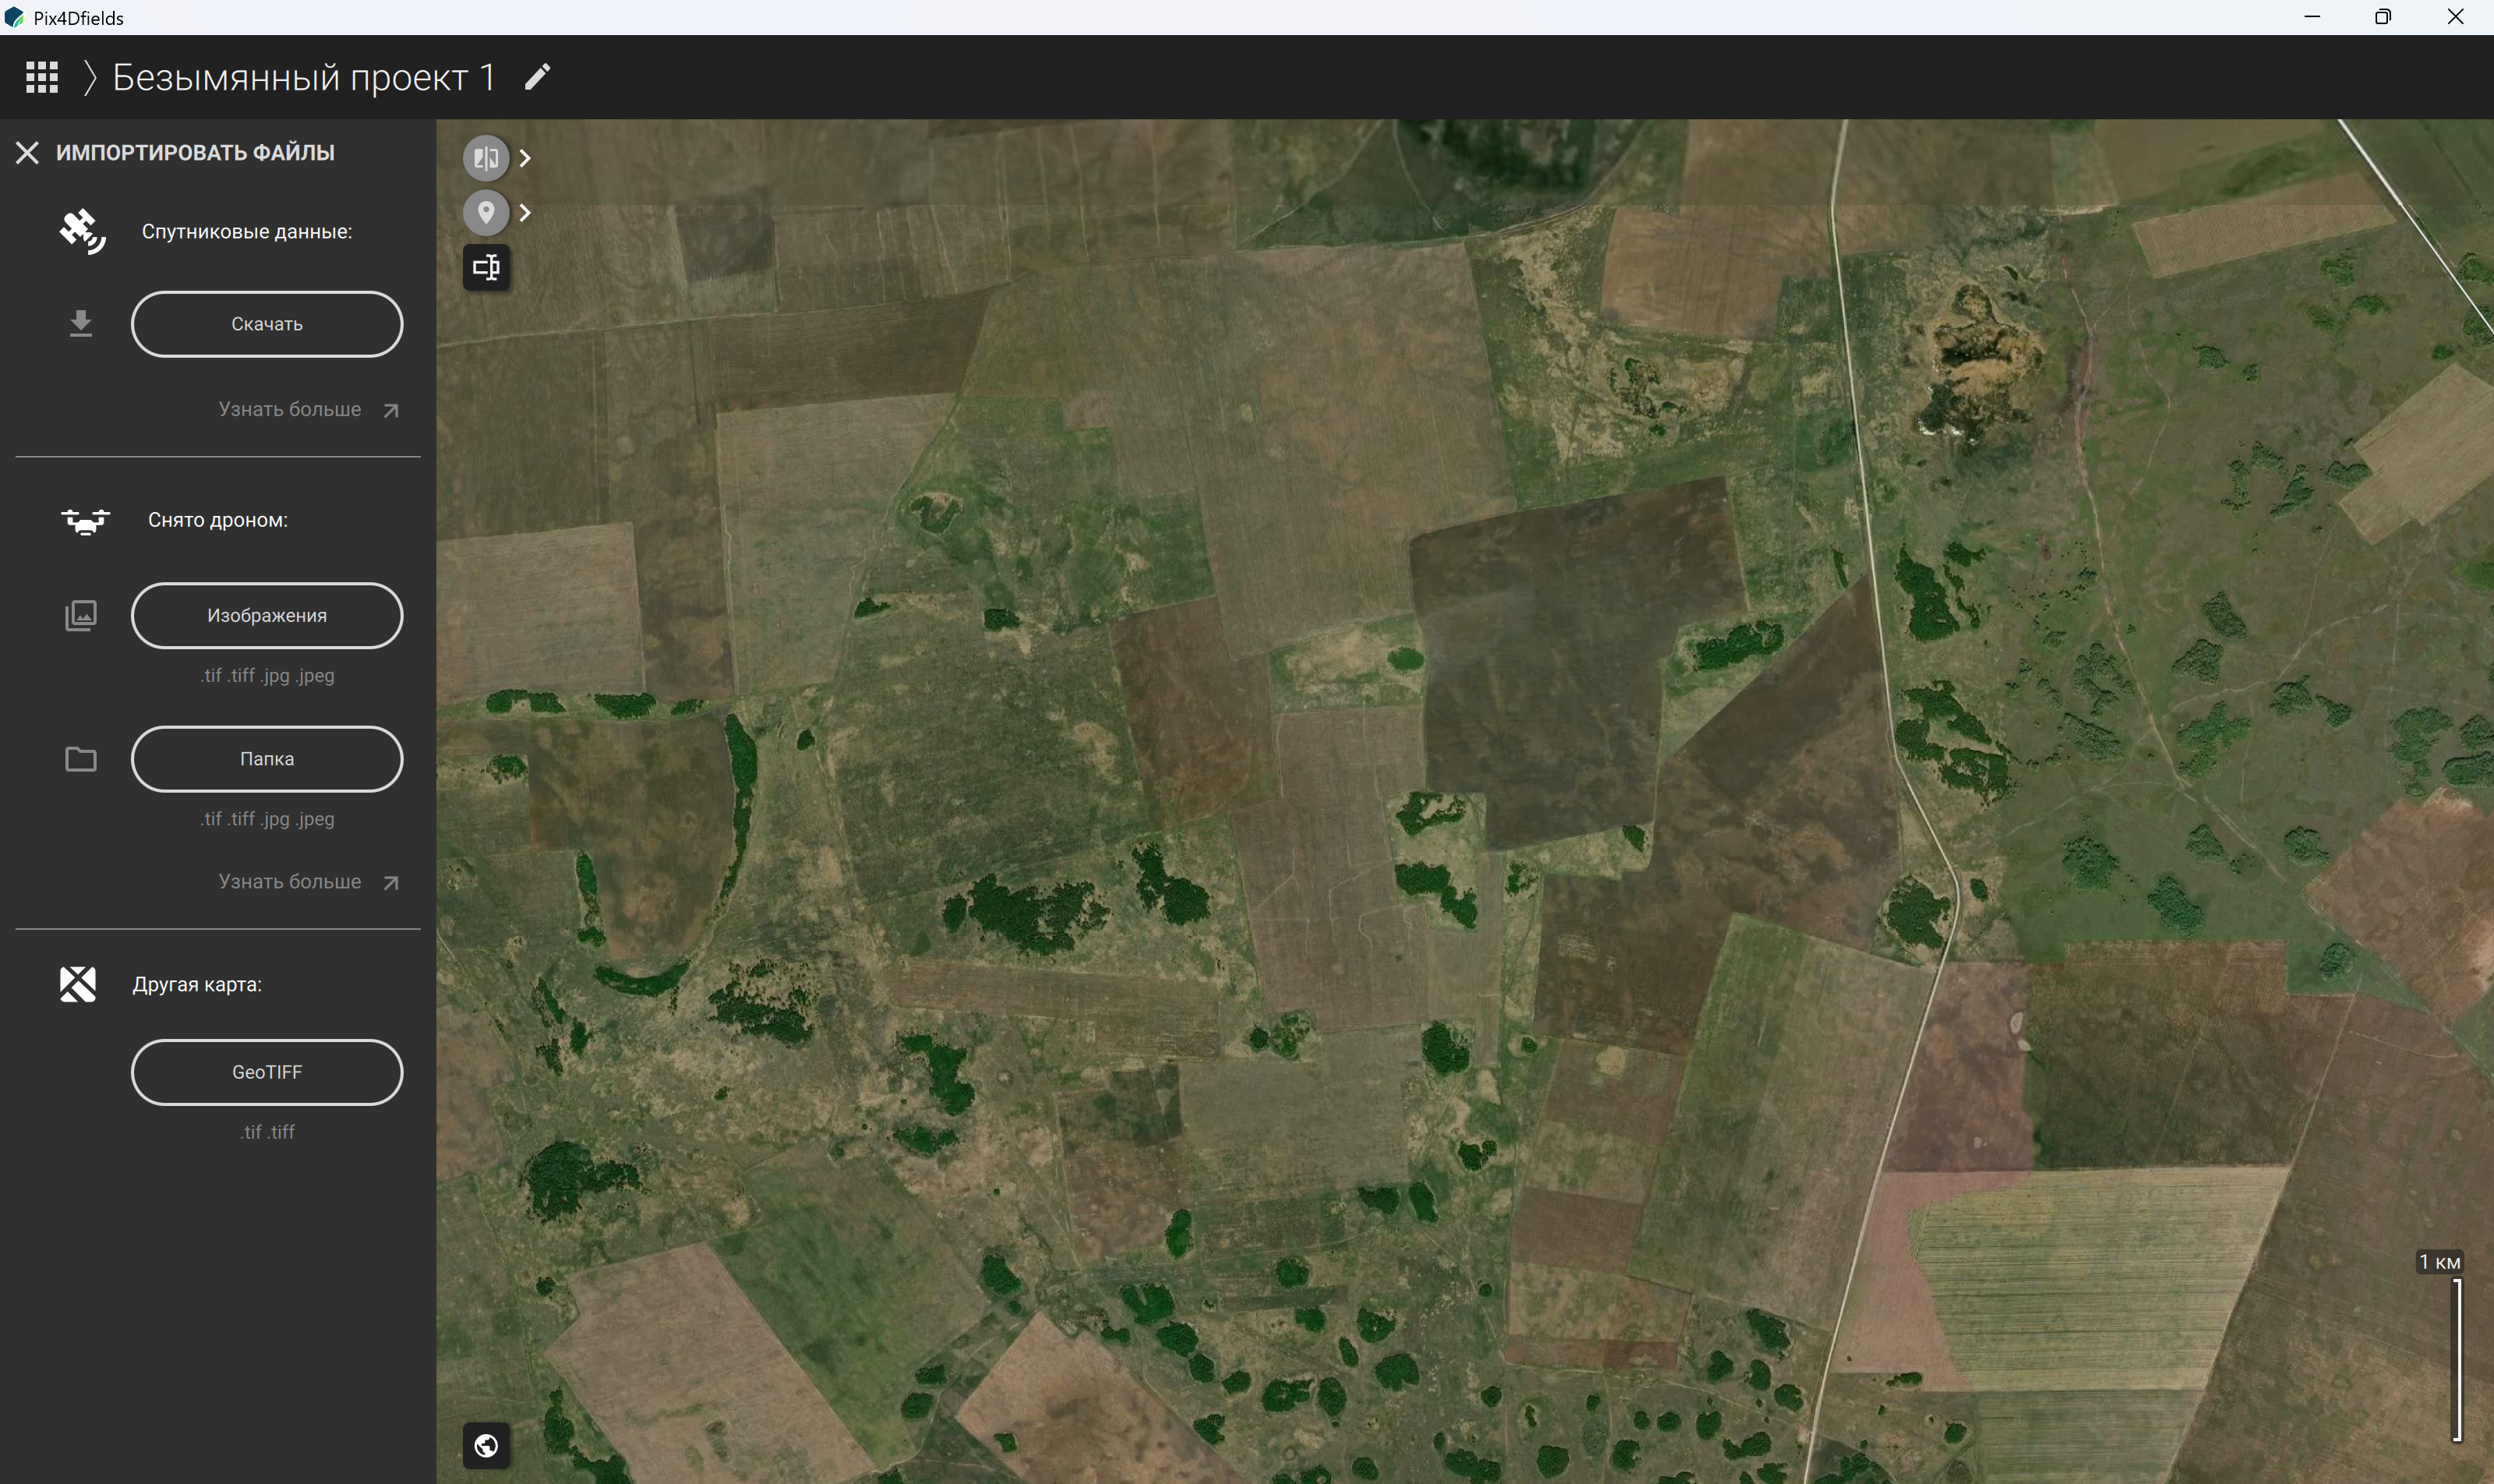
Figure 34 – Editing the default project name
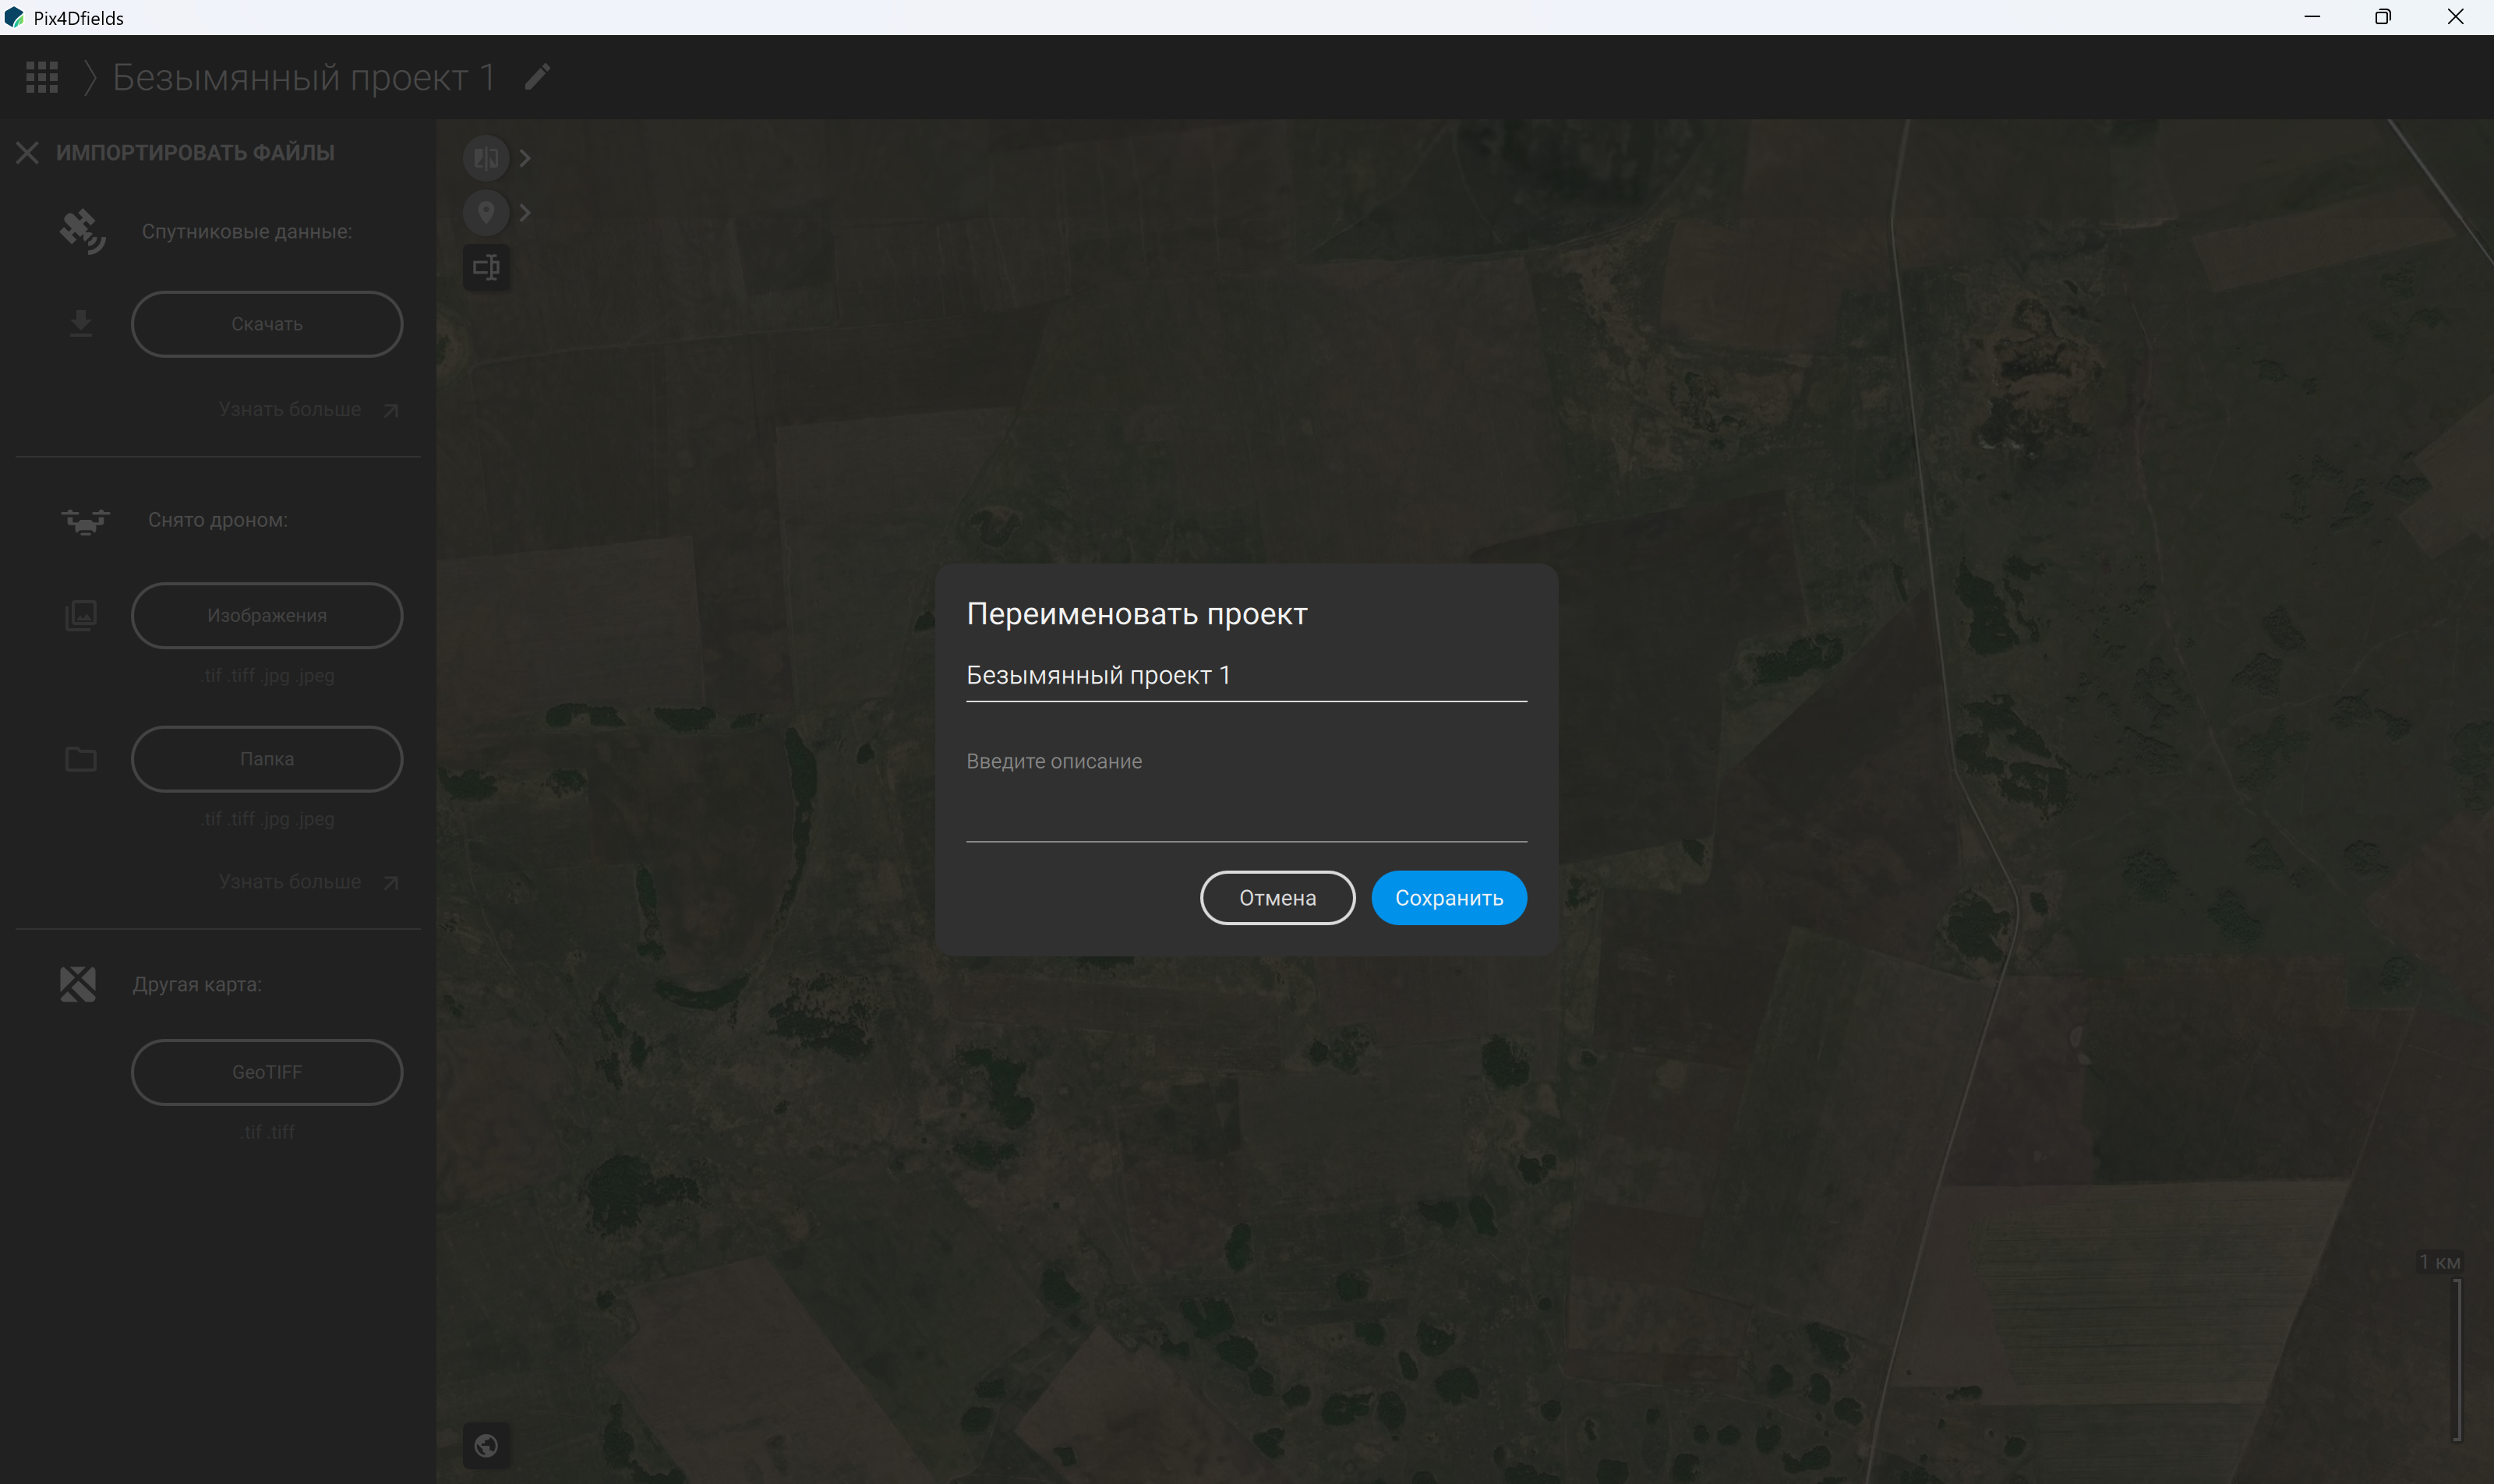
Figure 35 – Removing the default project name
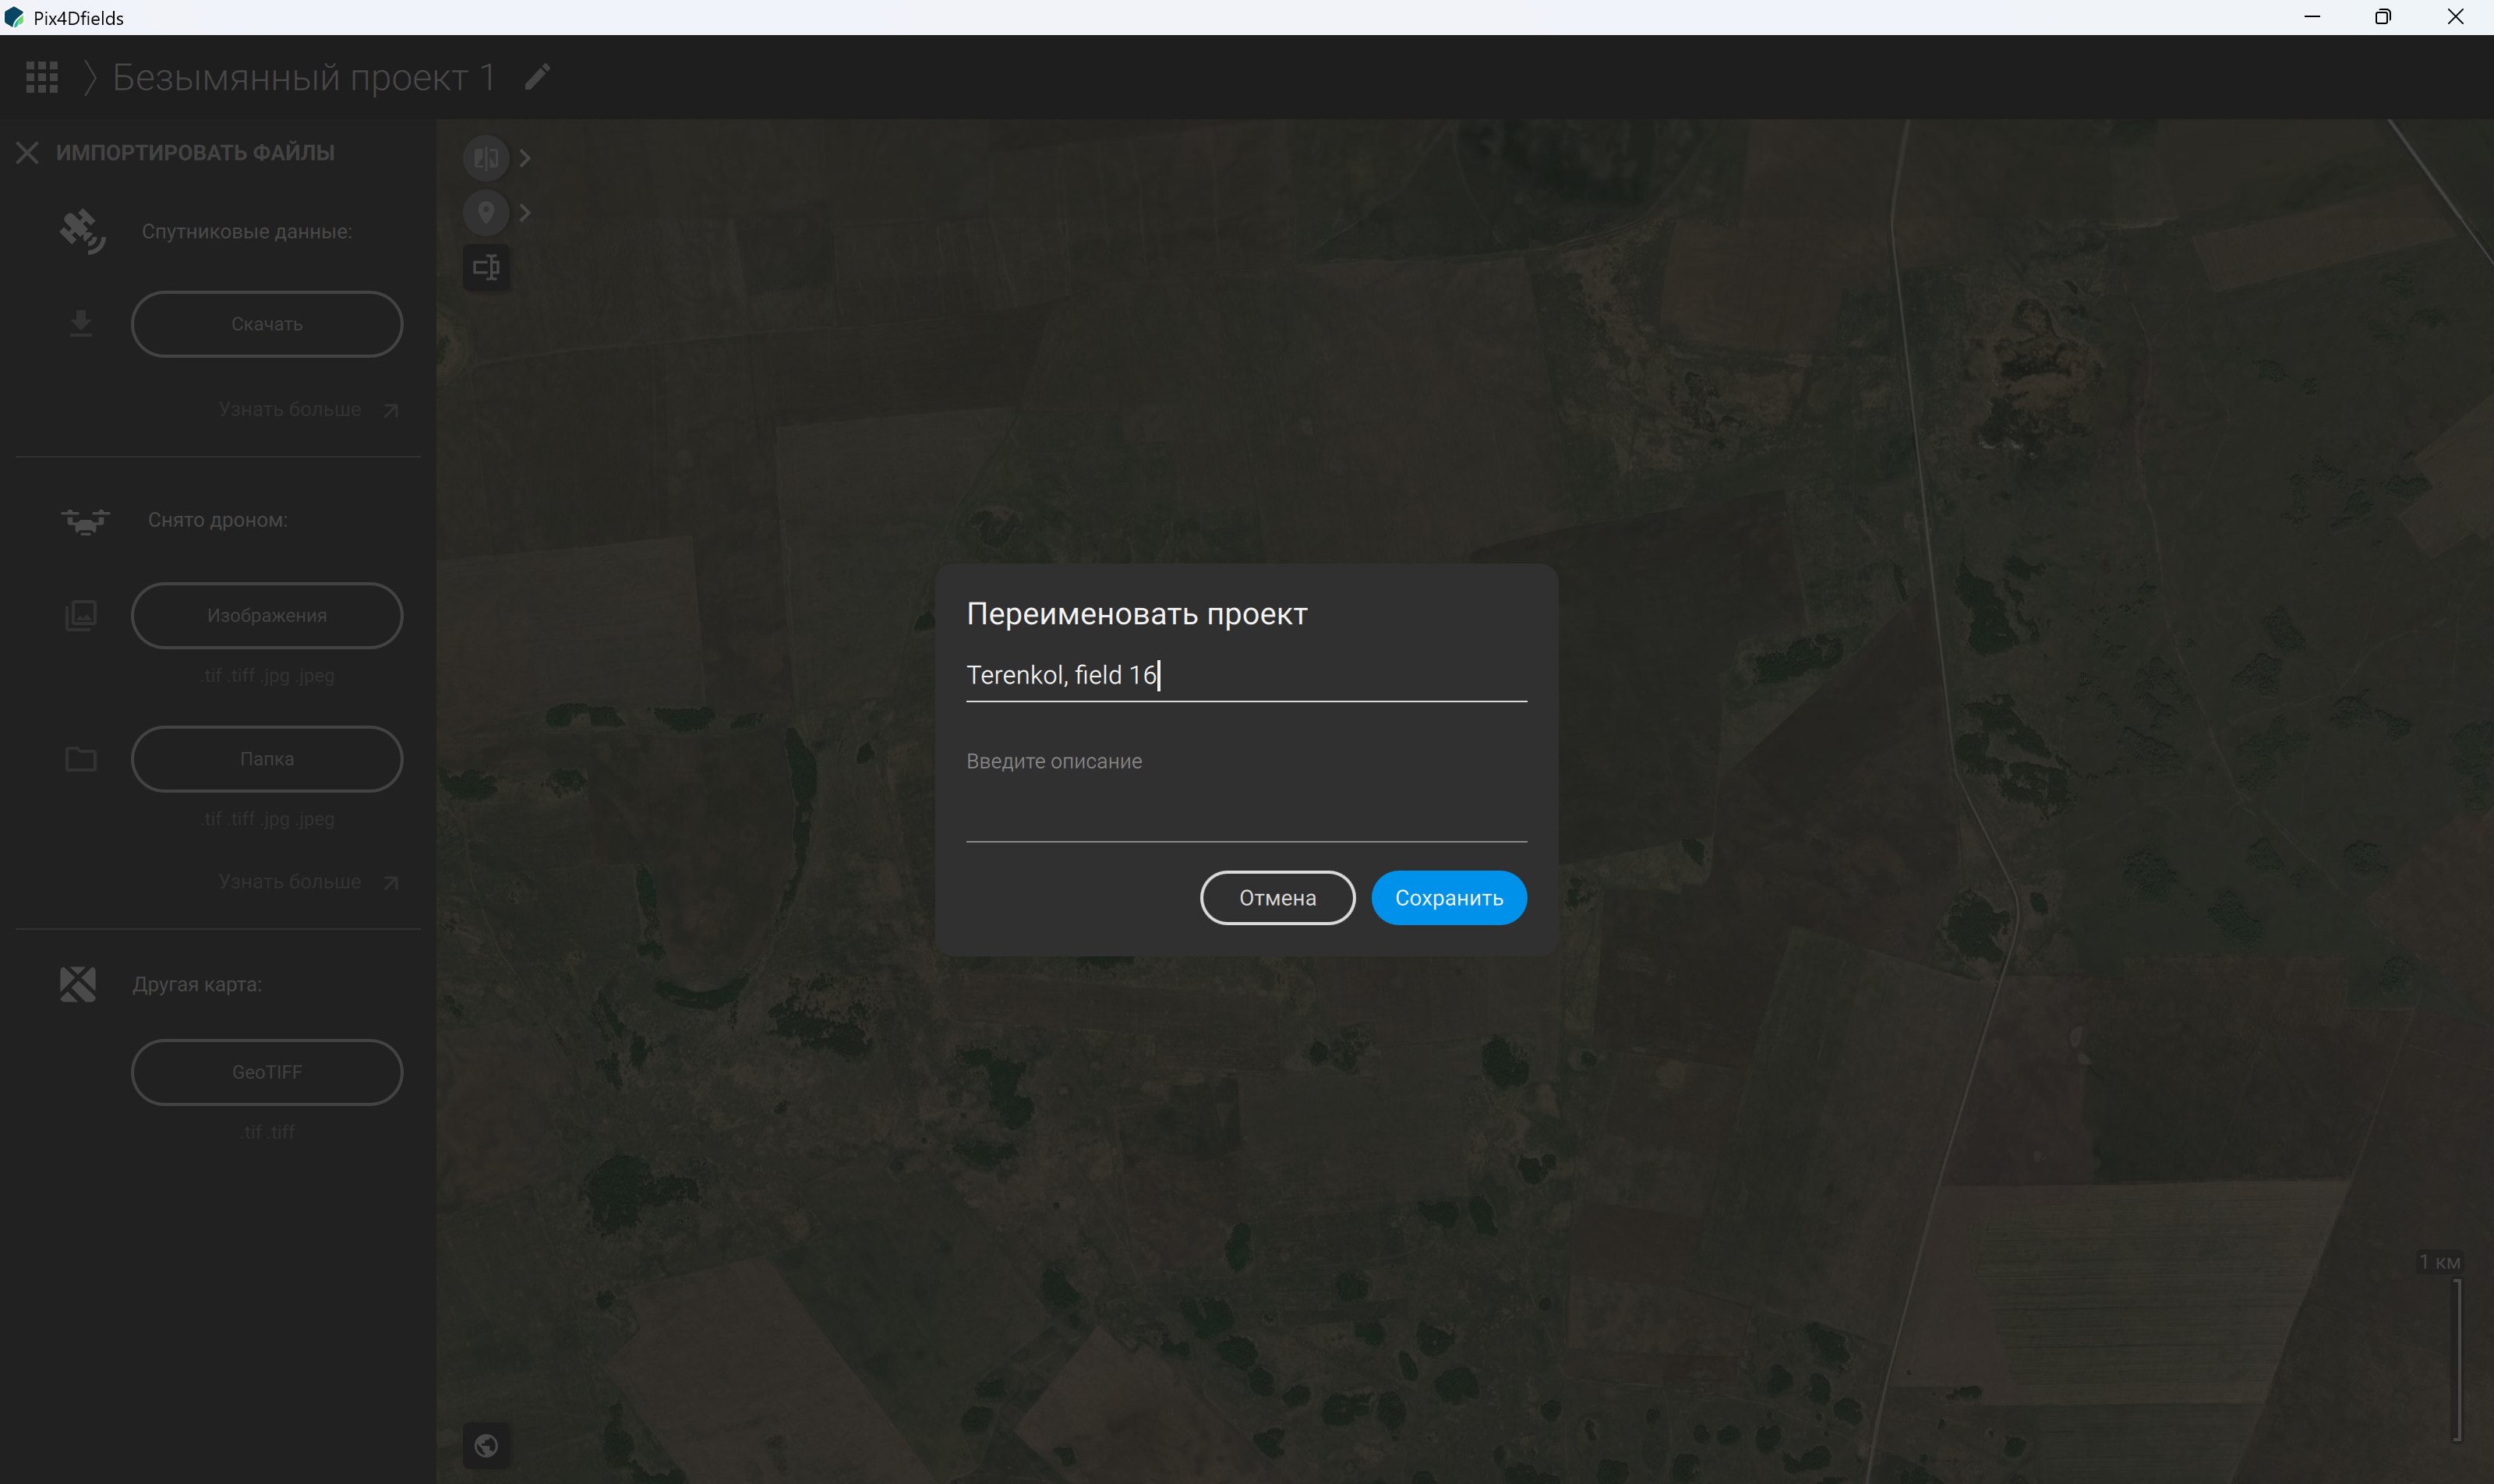
Figure 36 – Renaming the created project
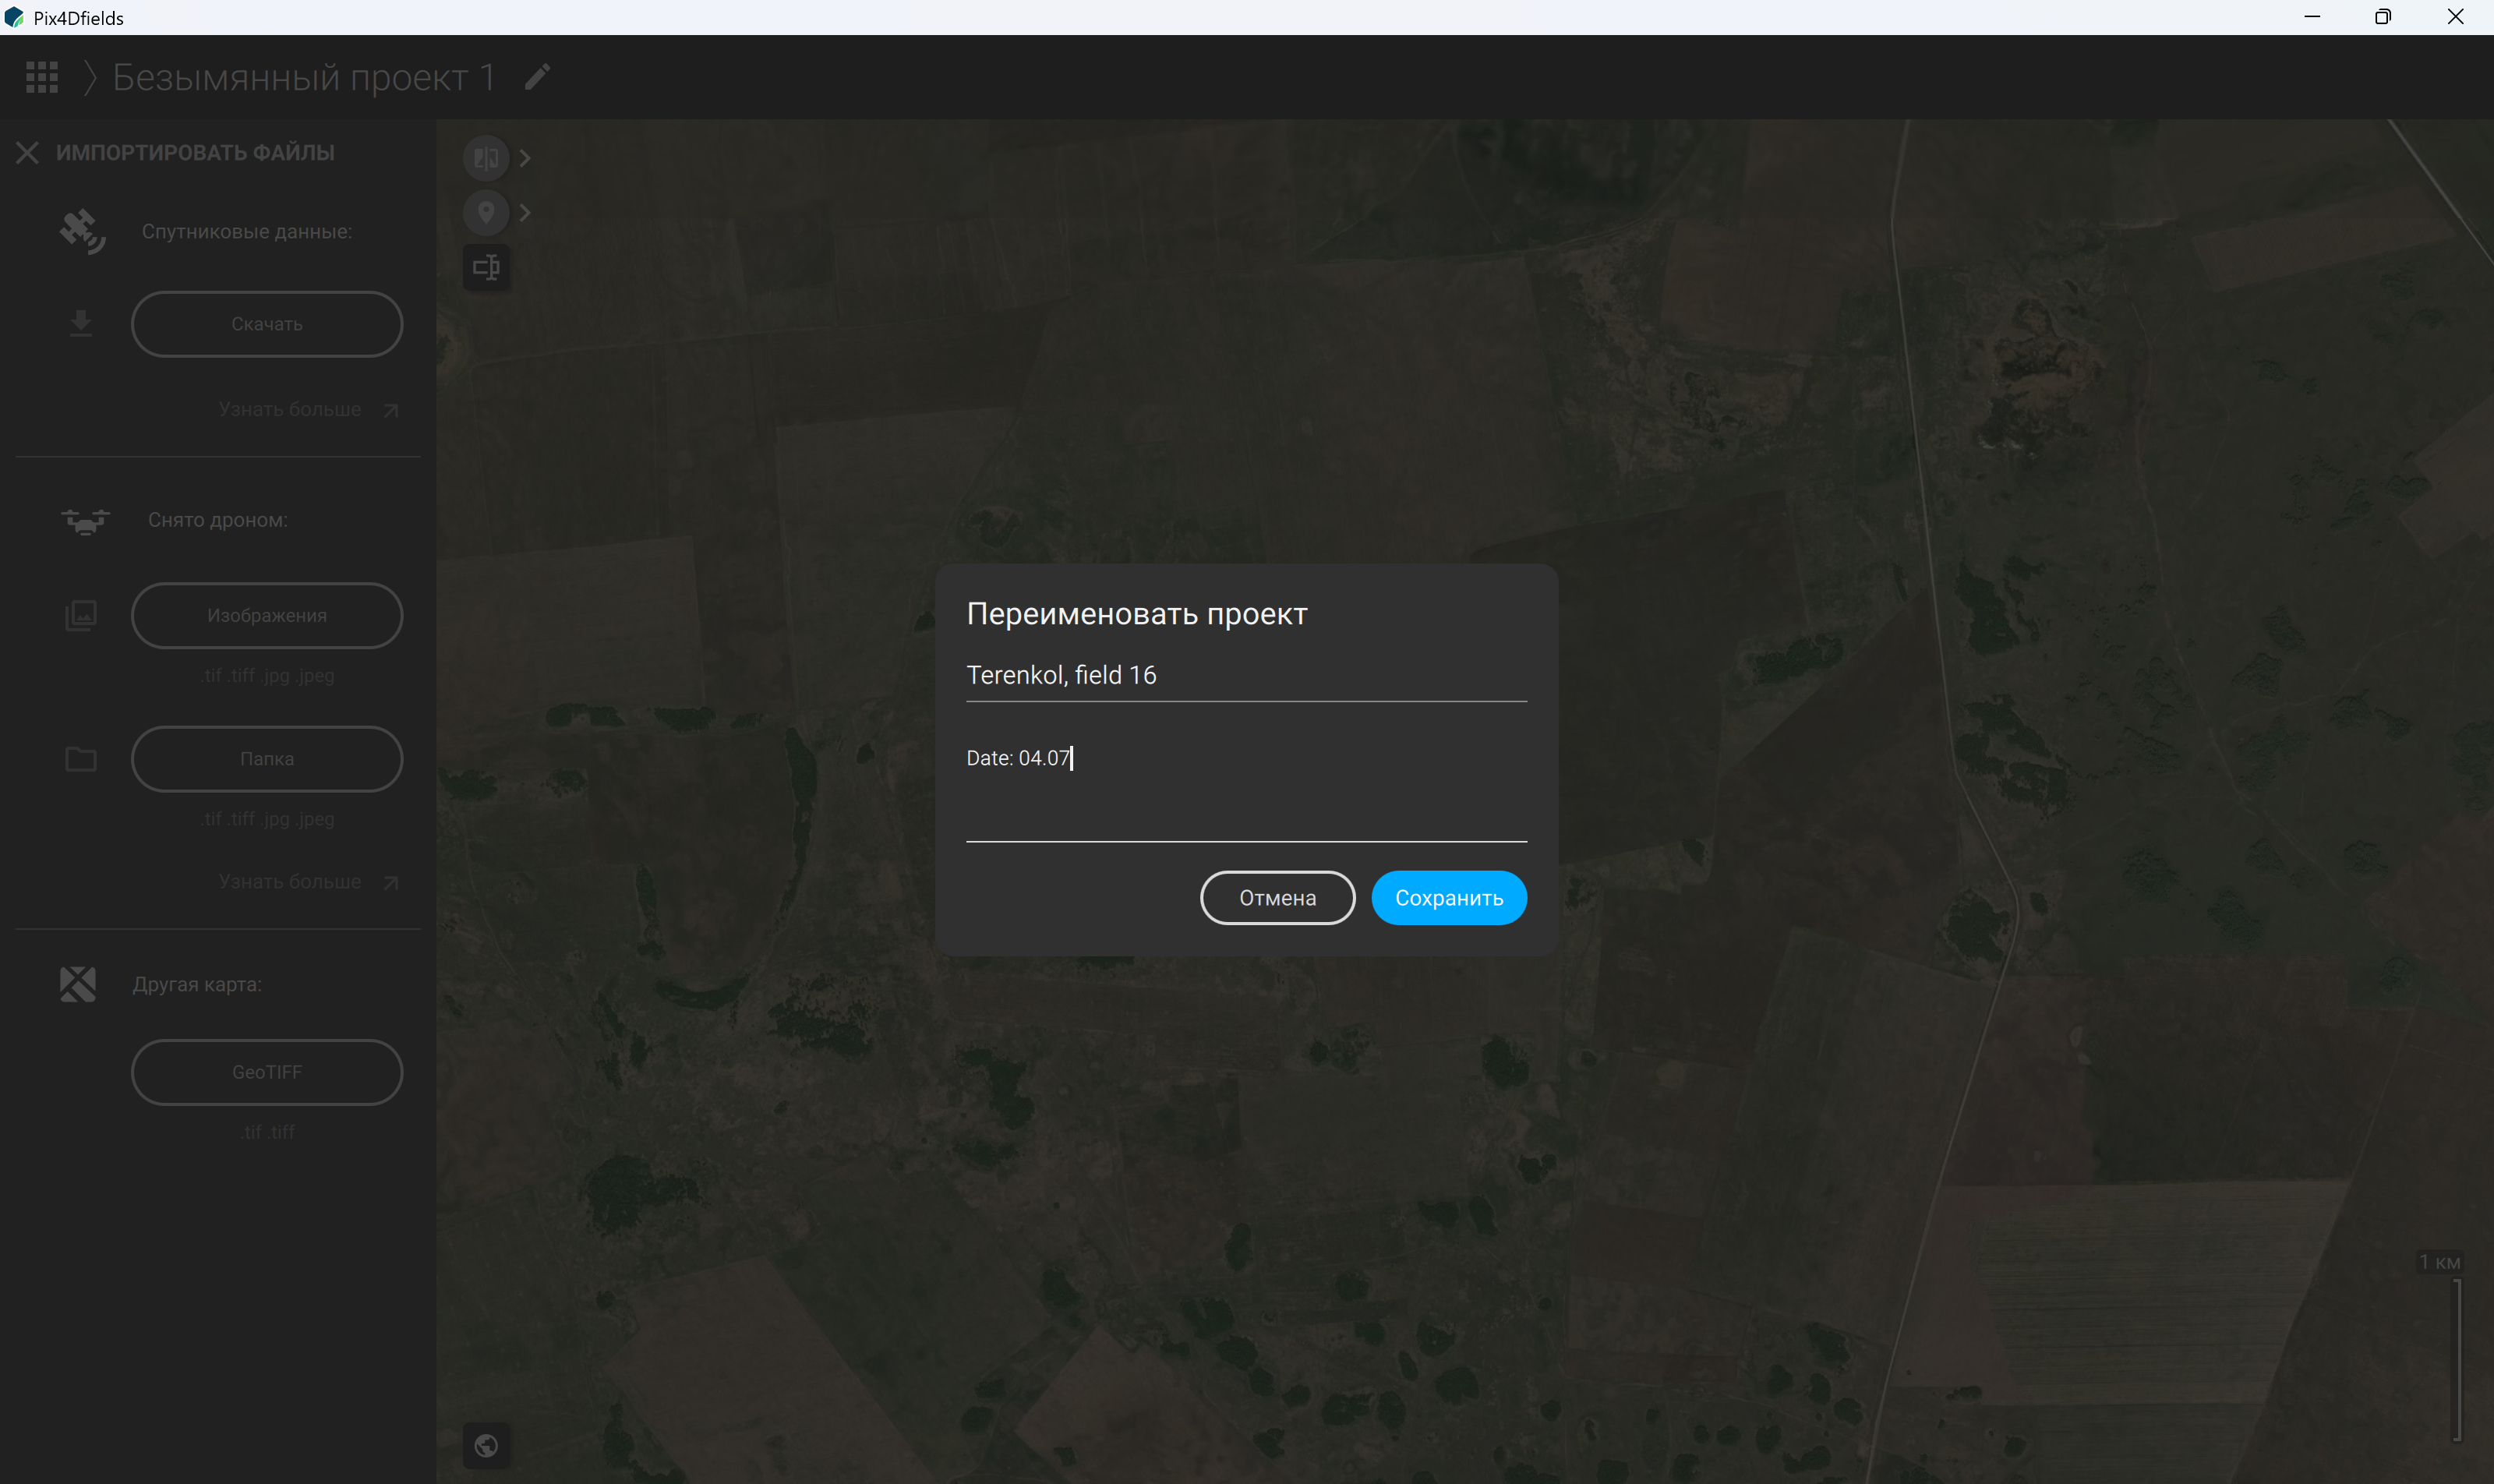
Figure 37 – Adding a description to the created project and saving its new name
Once the project has been created, its name appears in the upper-left corner of the interface (Figure 38), and the data import window opens automatically.
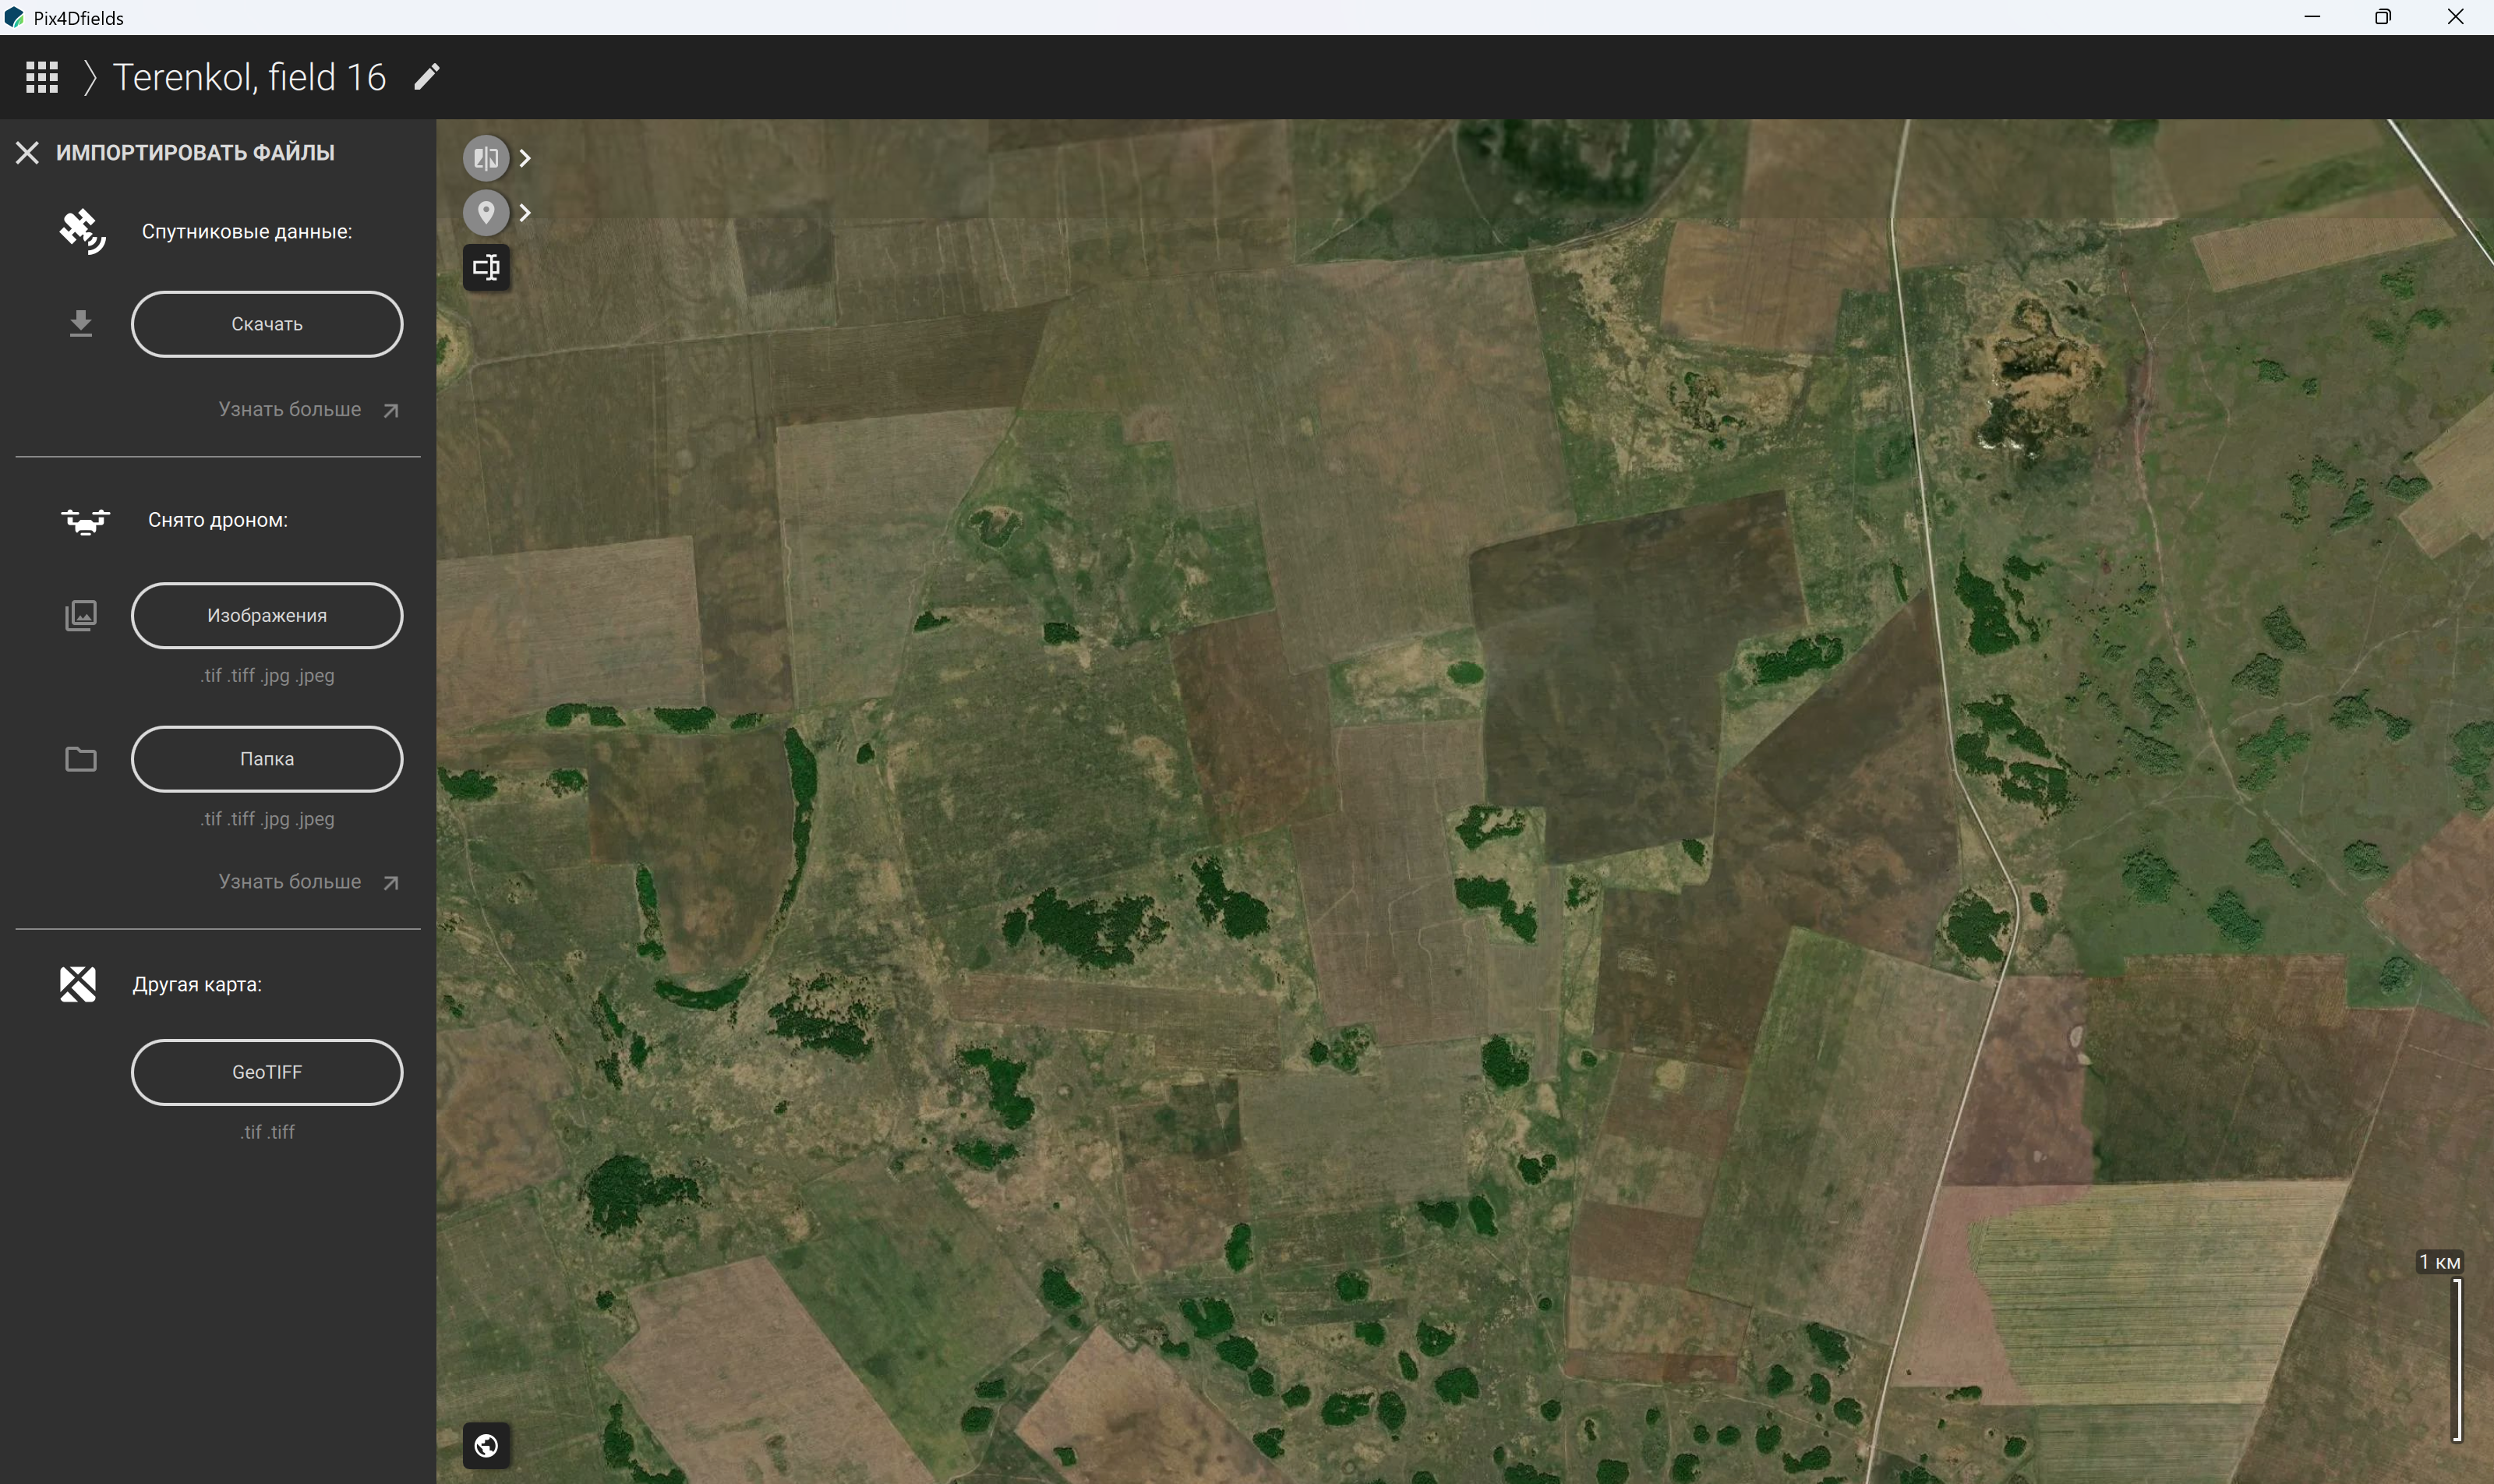
Figure 38 – Displaying the new project name in the upper panel of the software interface
The next stage involves importing the images acquired during the survey. Depending on the available dataset and the supported input options, the source imagery may consist of satellite data (Figures 39, 40) or images acquired using a UAV. To import individual images, select the “Images” command (Figure 41). If all images are stored in a single directory, select the “Folder” command in the import panel on the left (Figure 42). Then, navigate to the required folder and click “Open”. The software also supports the import of third-party maps in TIFF format (“.tif” or “.tiff”), where compatible with the selected workflow (Figure 43). Supported image formats include JPEG (“.jpg” and “.jpeg”) (Figure 44) and TIFF (“.tif” and “.tiff”) (Figure 45). For multispectral applications, the suitability of JPEG or TIFF imagery depends on the camera model, the structure of the image files, and the requirements of the intended processing workflow. After selecting the required files, click “Continue” to proceed (Figure 45).
The imported files are then scanned and prepared for processing (Figure 46), after which the processing options are displayed. If necessary, the scanning or loading operation can be interrupted by clicking the blue “Stop processing” button next to the progress indicator (Figure 46). By default, the software may offer “Fast Processing” mode (Figure 47). Depending on the software version and available settings, this mode may include relative camera calibration (Figure 48), radiometric correction, and GPU acceleration options (Figure 49). These settings are intended to streamline processing and provide results efficiently, making this mode potentially suitable for field-based agricultural monitoring and rapid assessment of vegetation conditions.
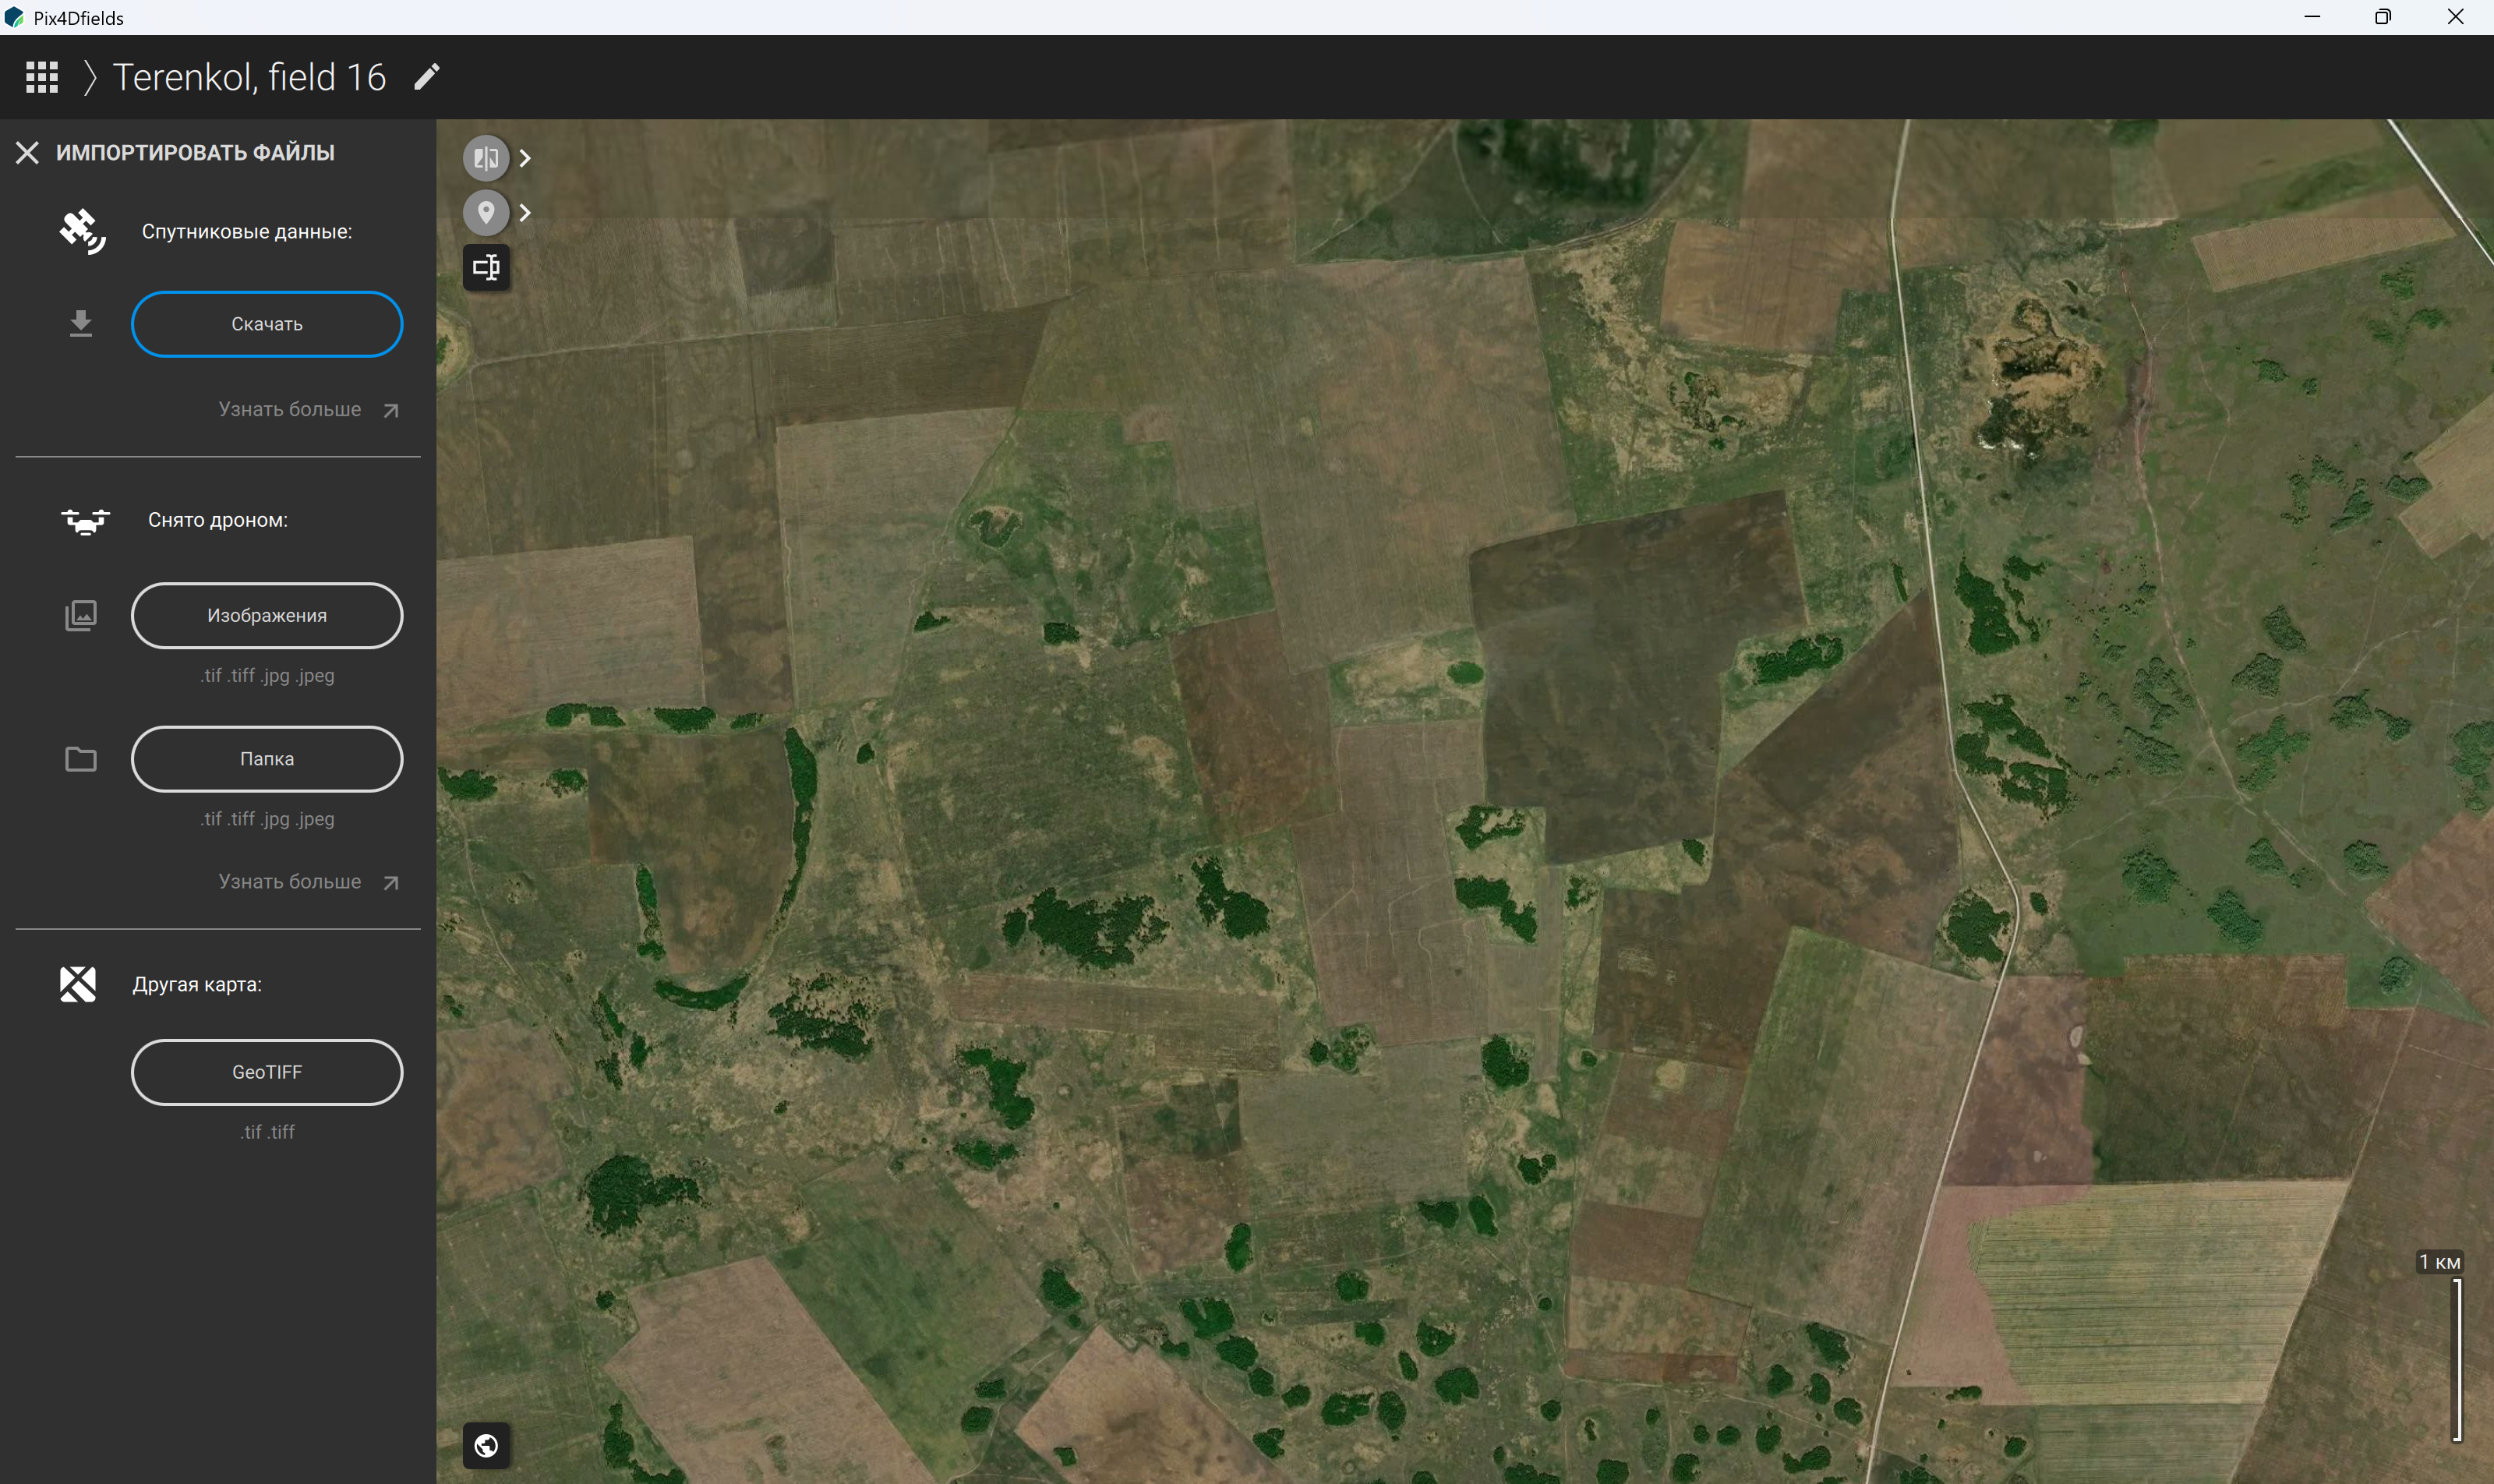
Figure 39 – Importing satellite imagery and (or) other supported data
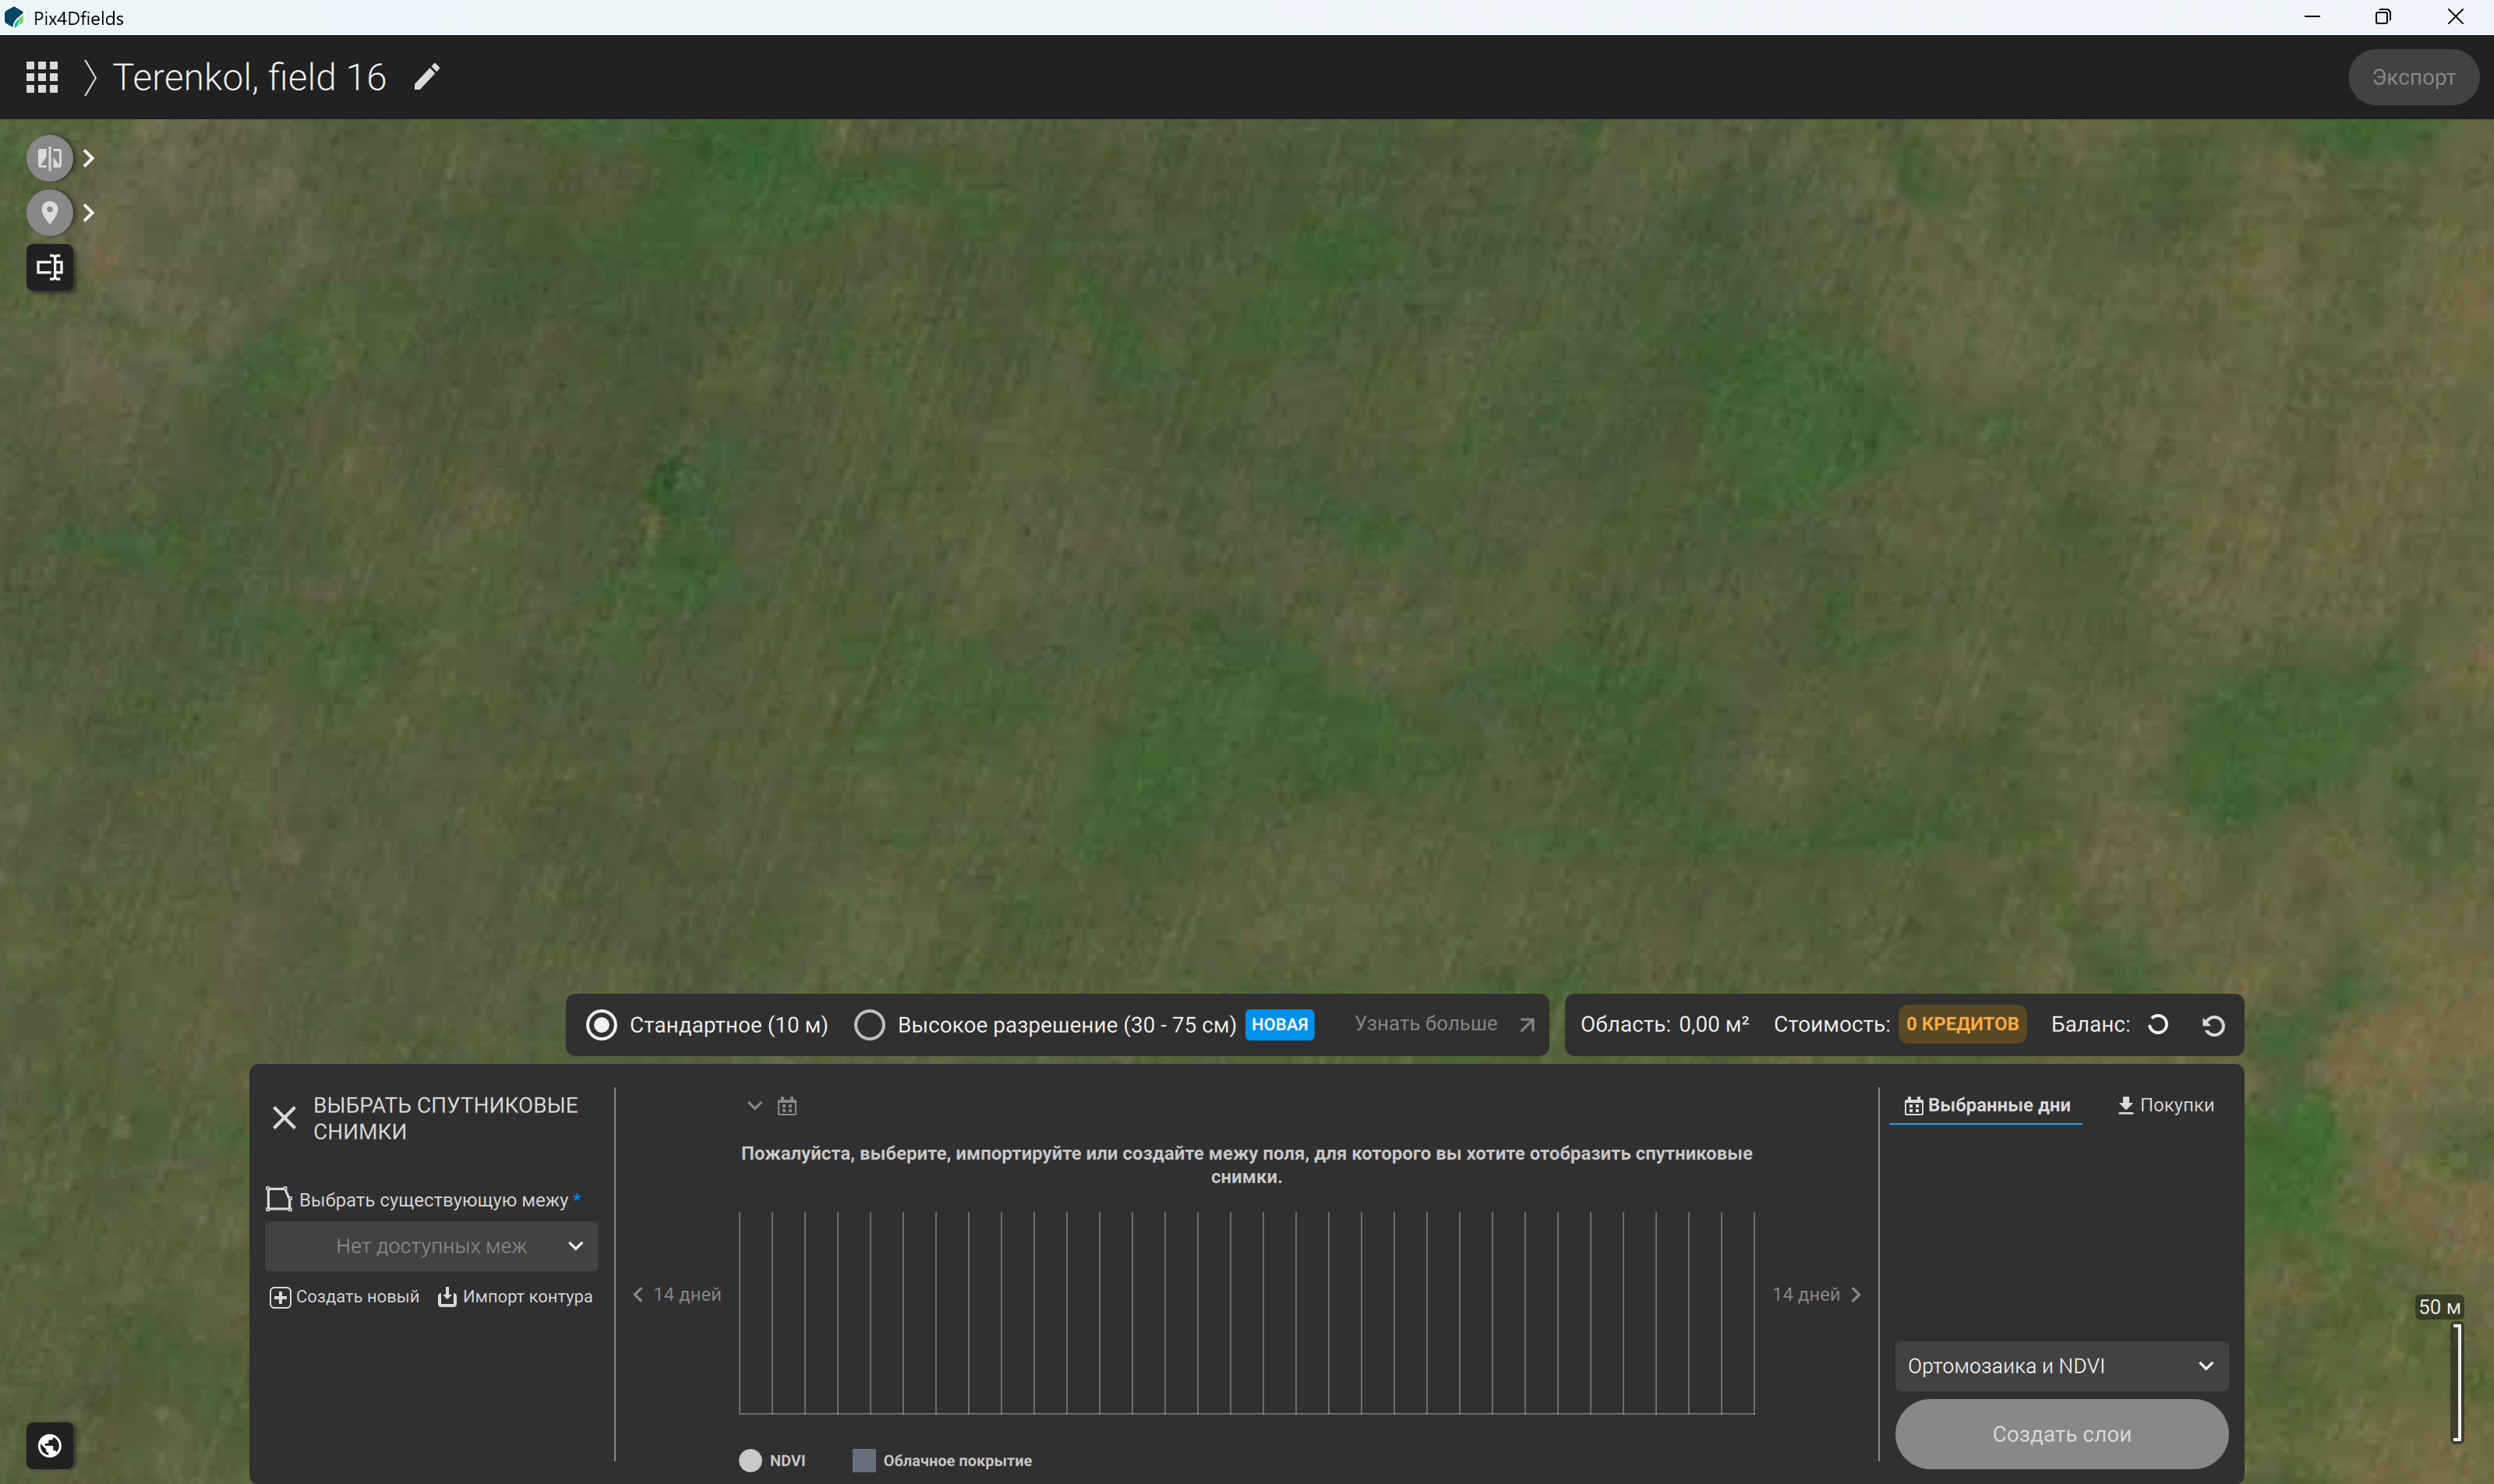
Figure 40 – Selecting satellite imagery based on specified parameters
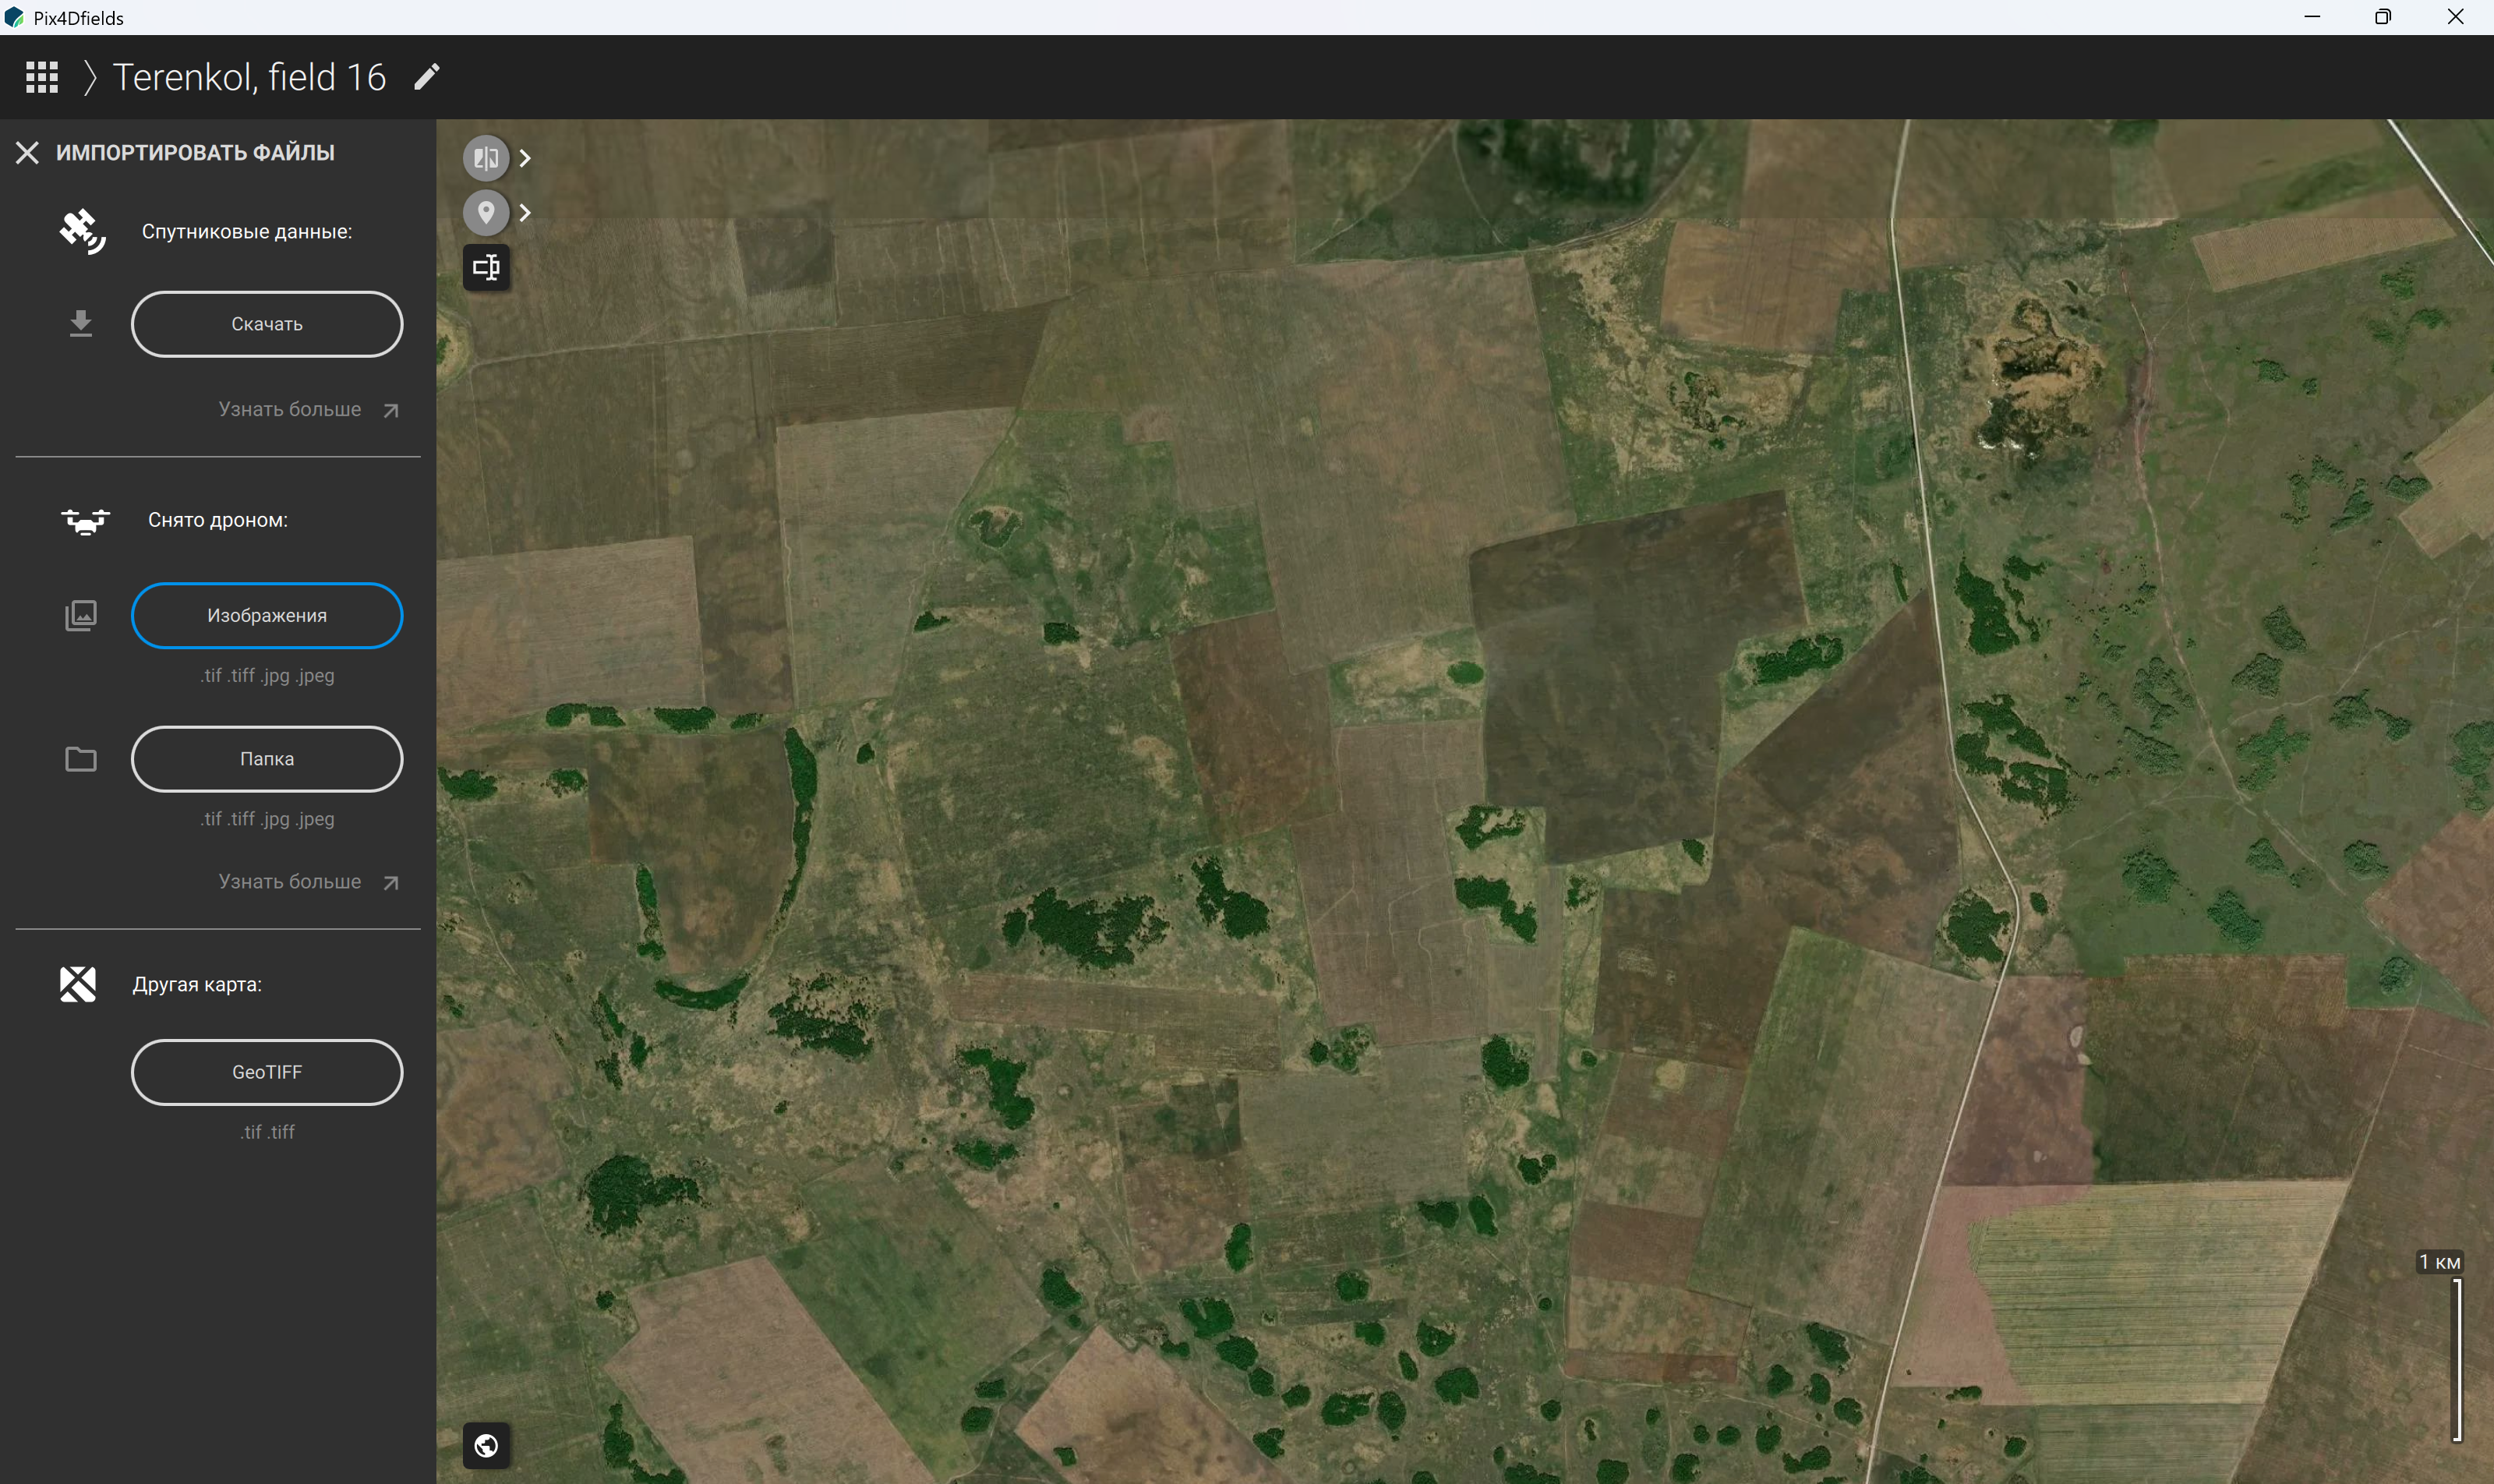
Figure 41 – Importing individual images acquired during a UAV survey
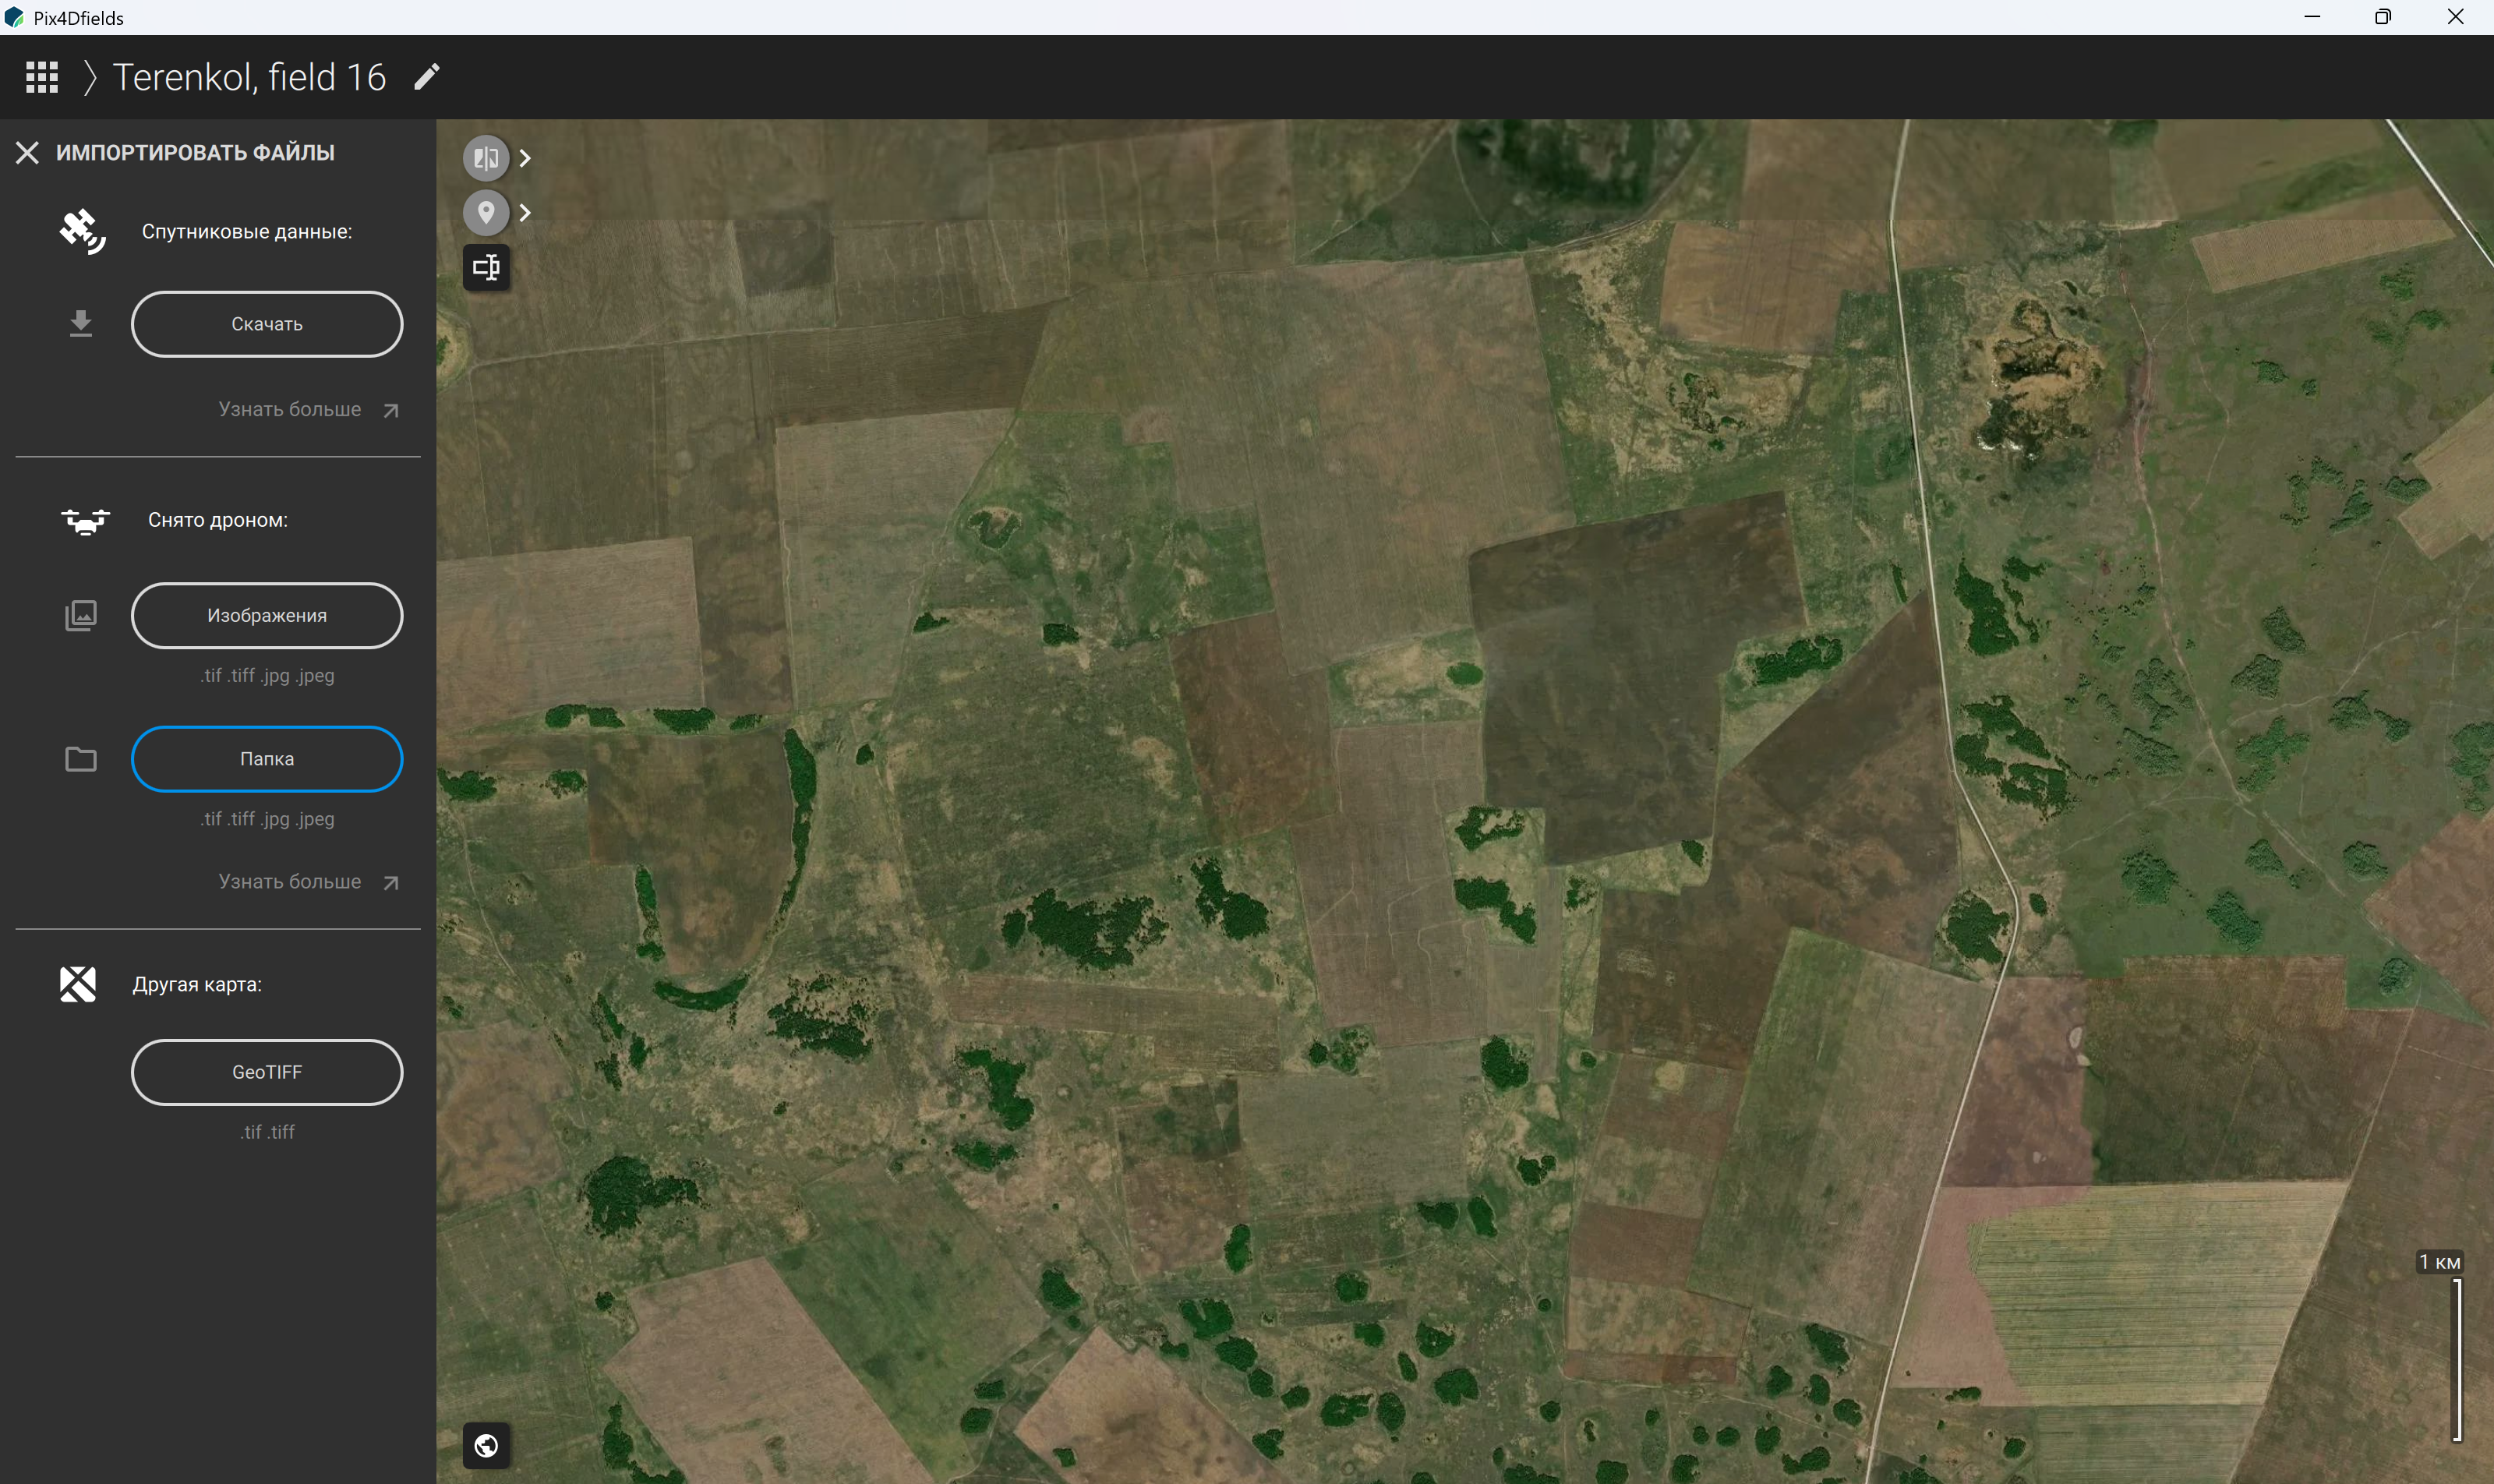
Figure 42 – Importing a folder containing UAV survey images
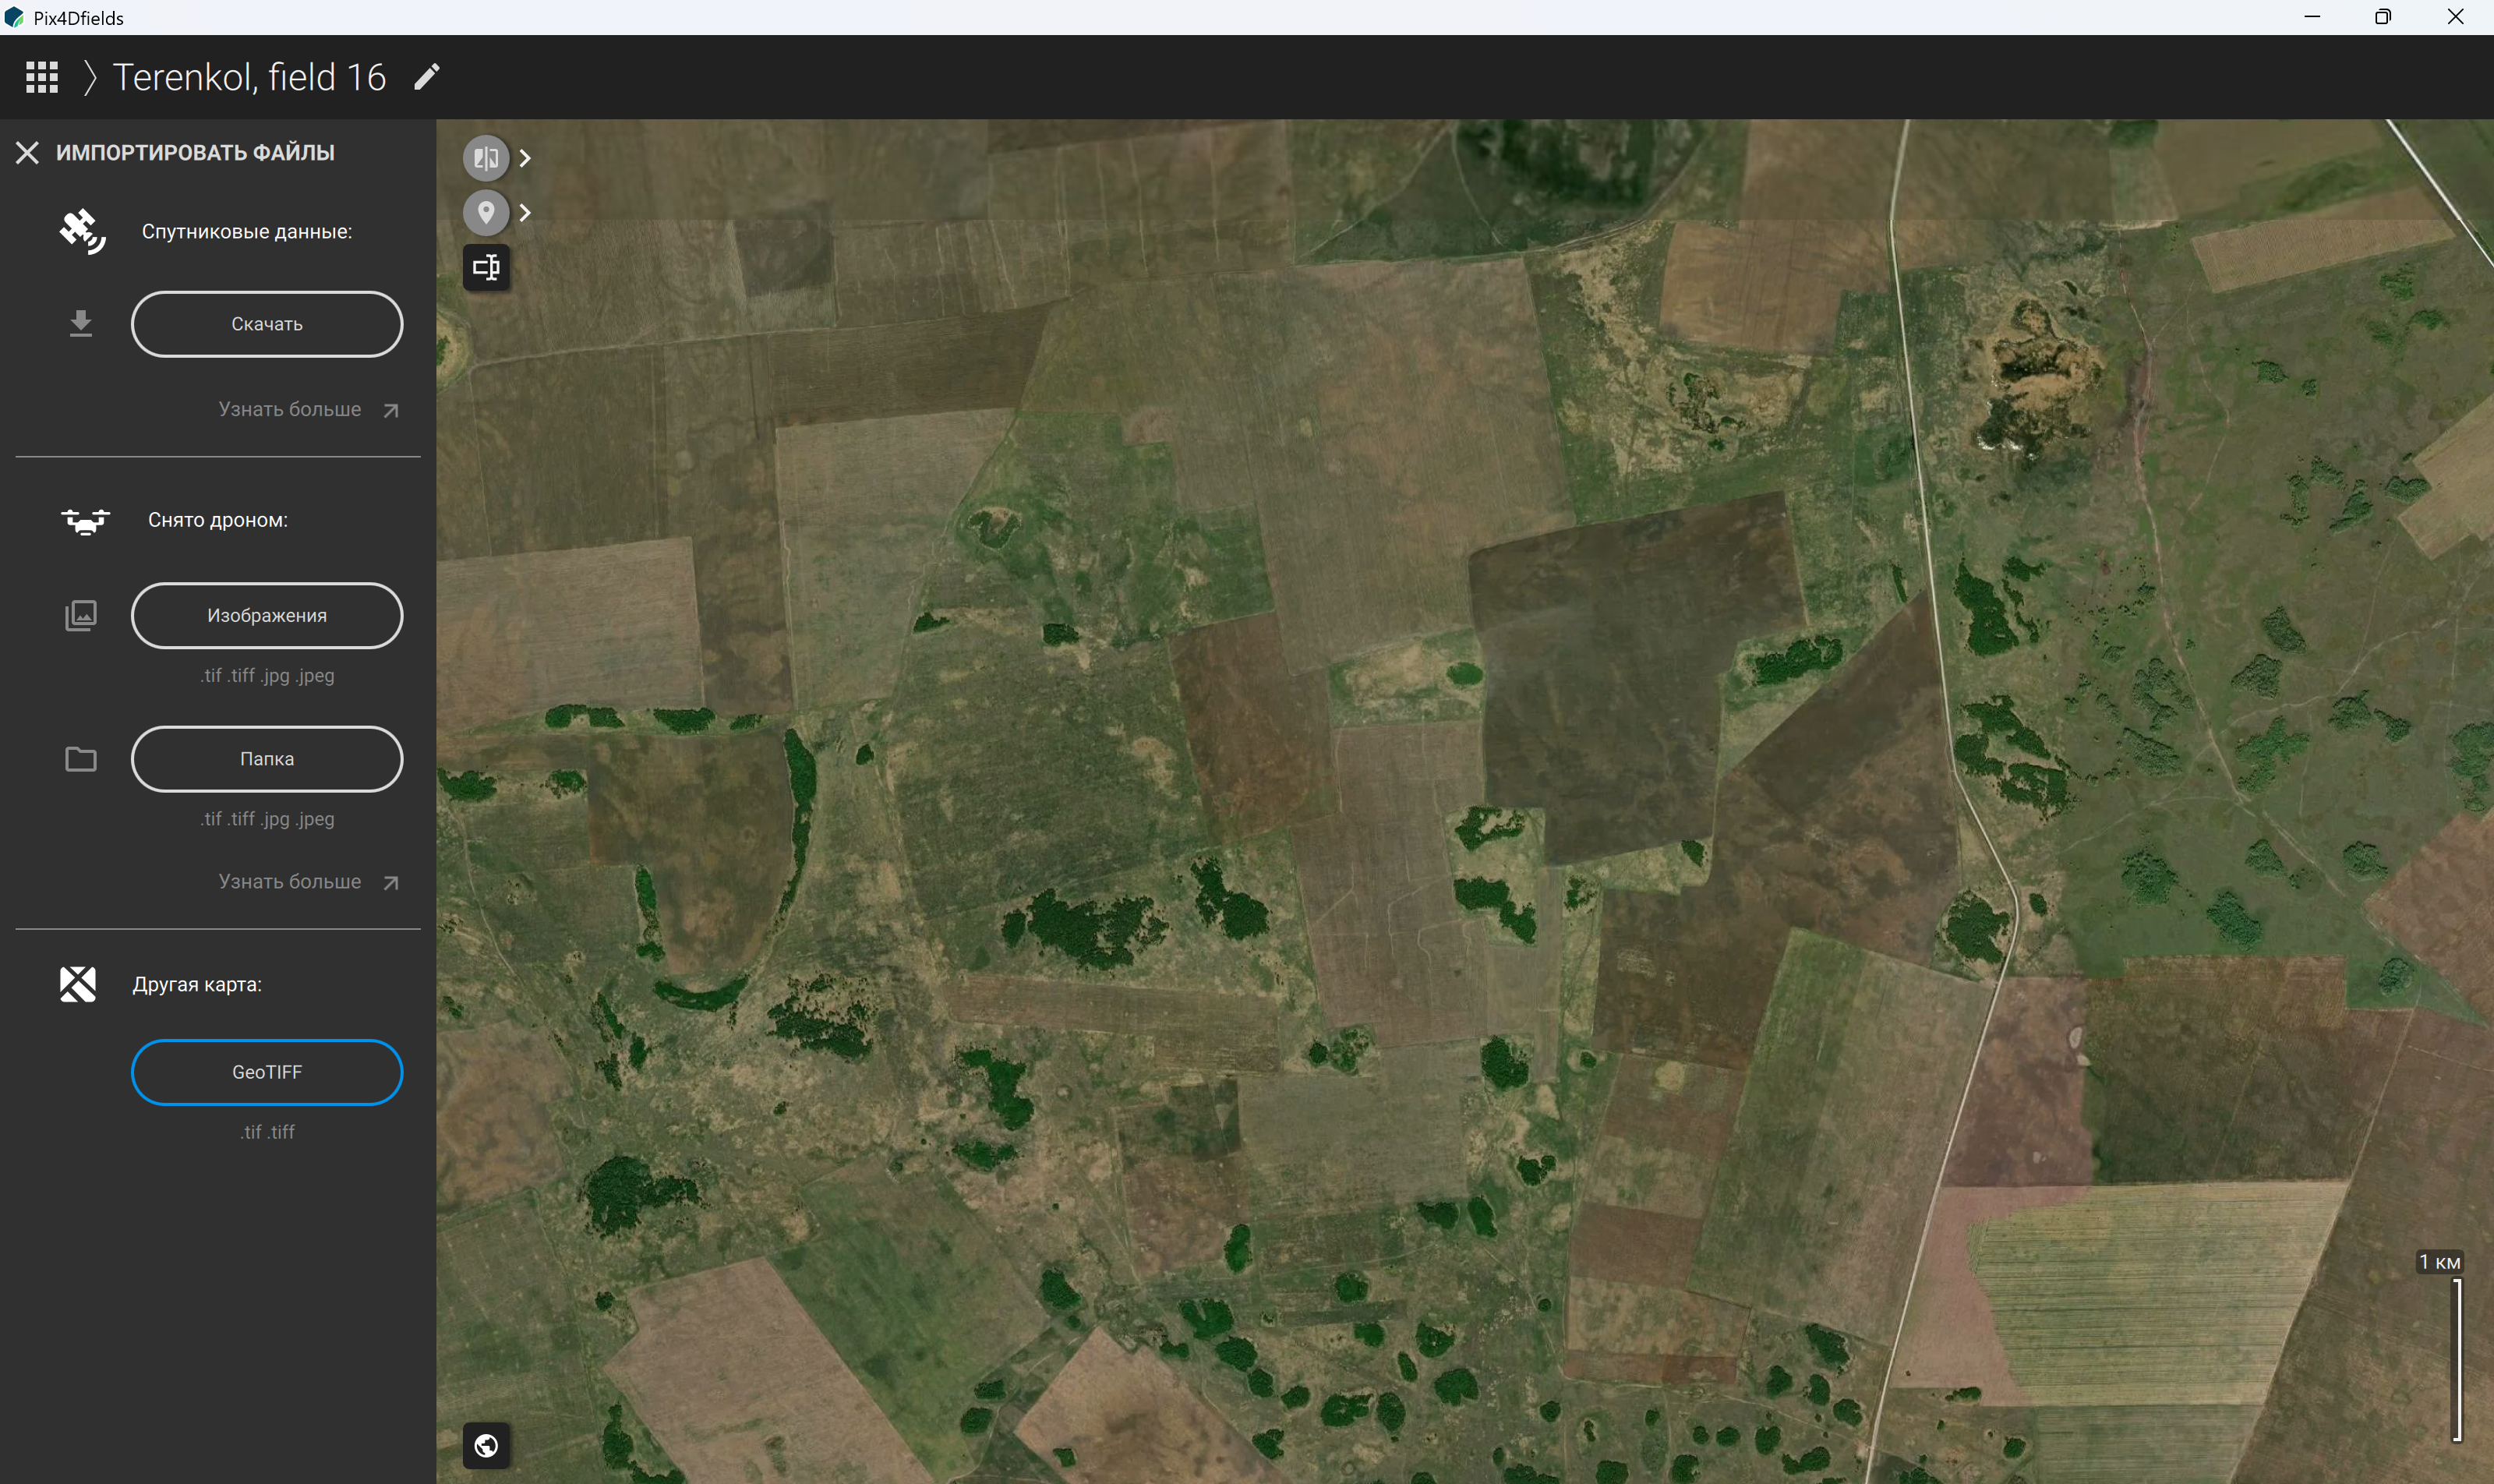
Figure 43 – Importing a third-party map in “.tif” or “.tiff” format
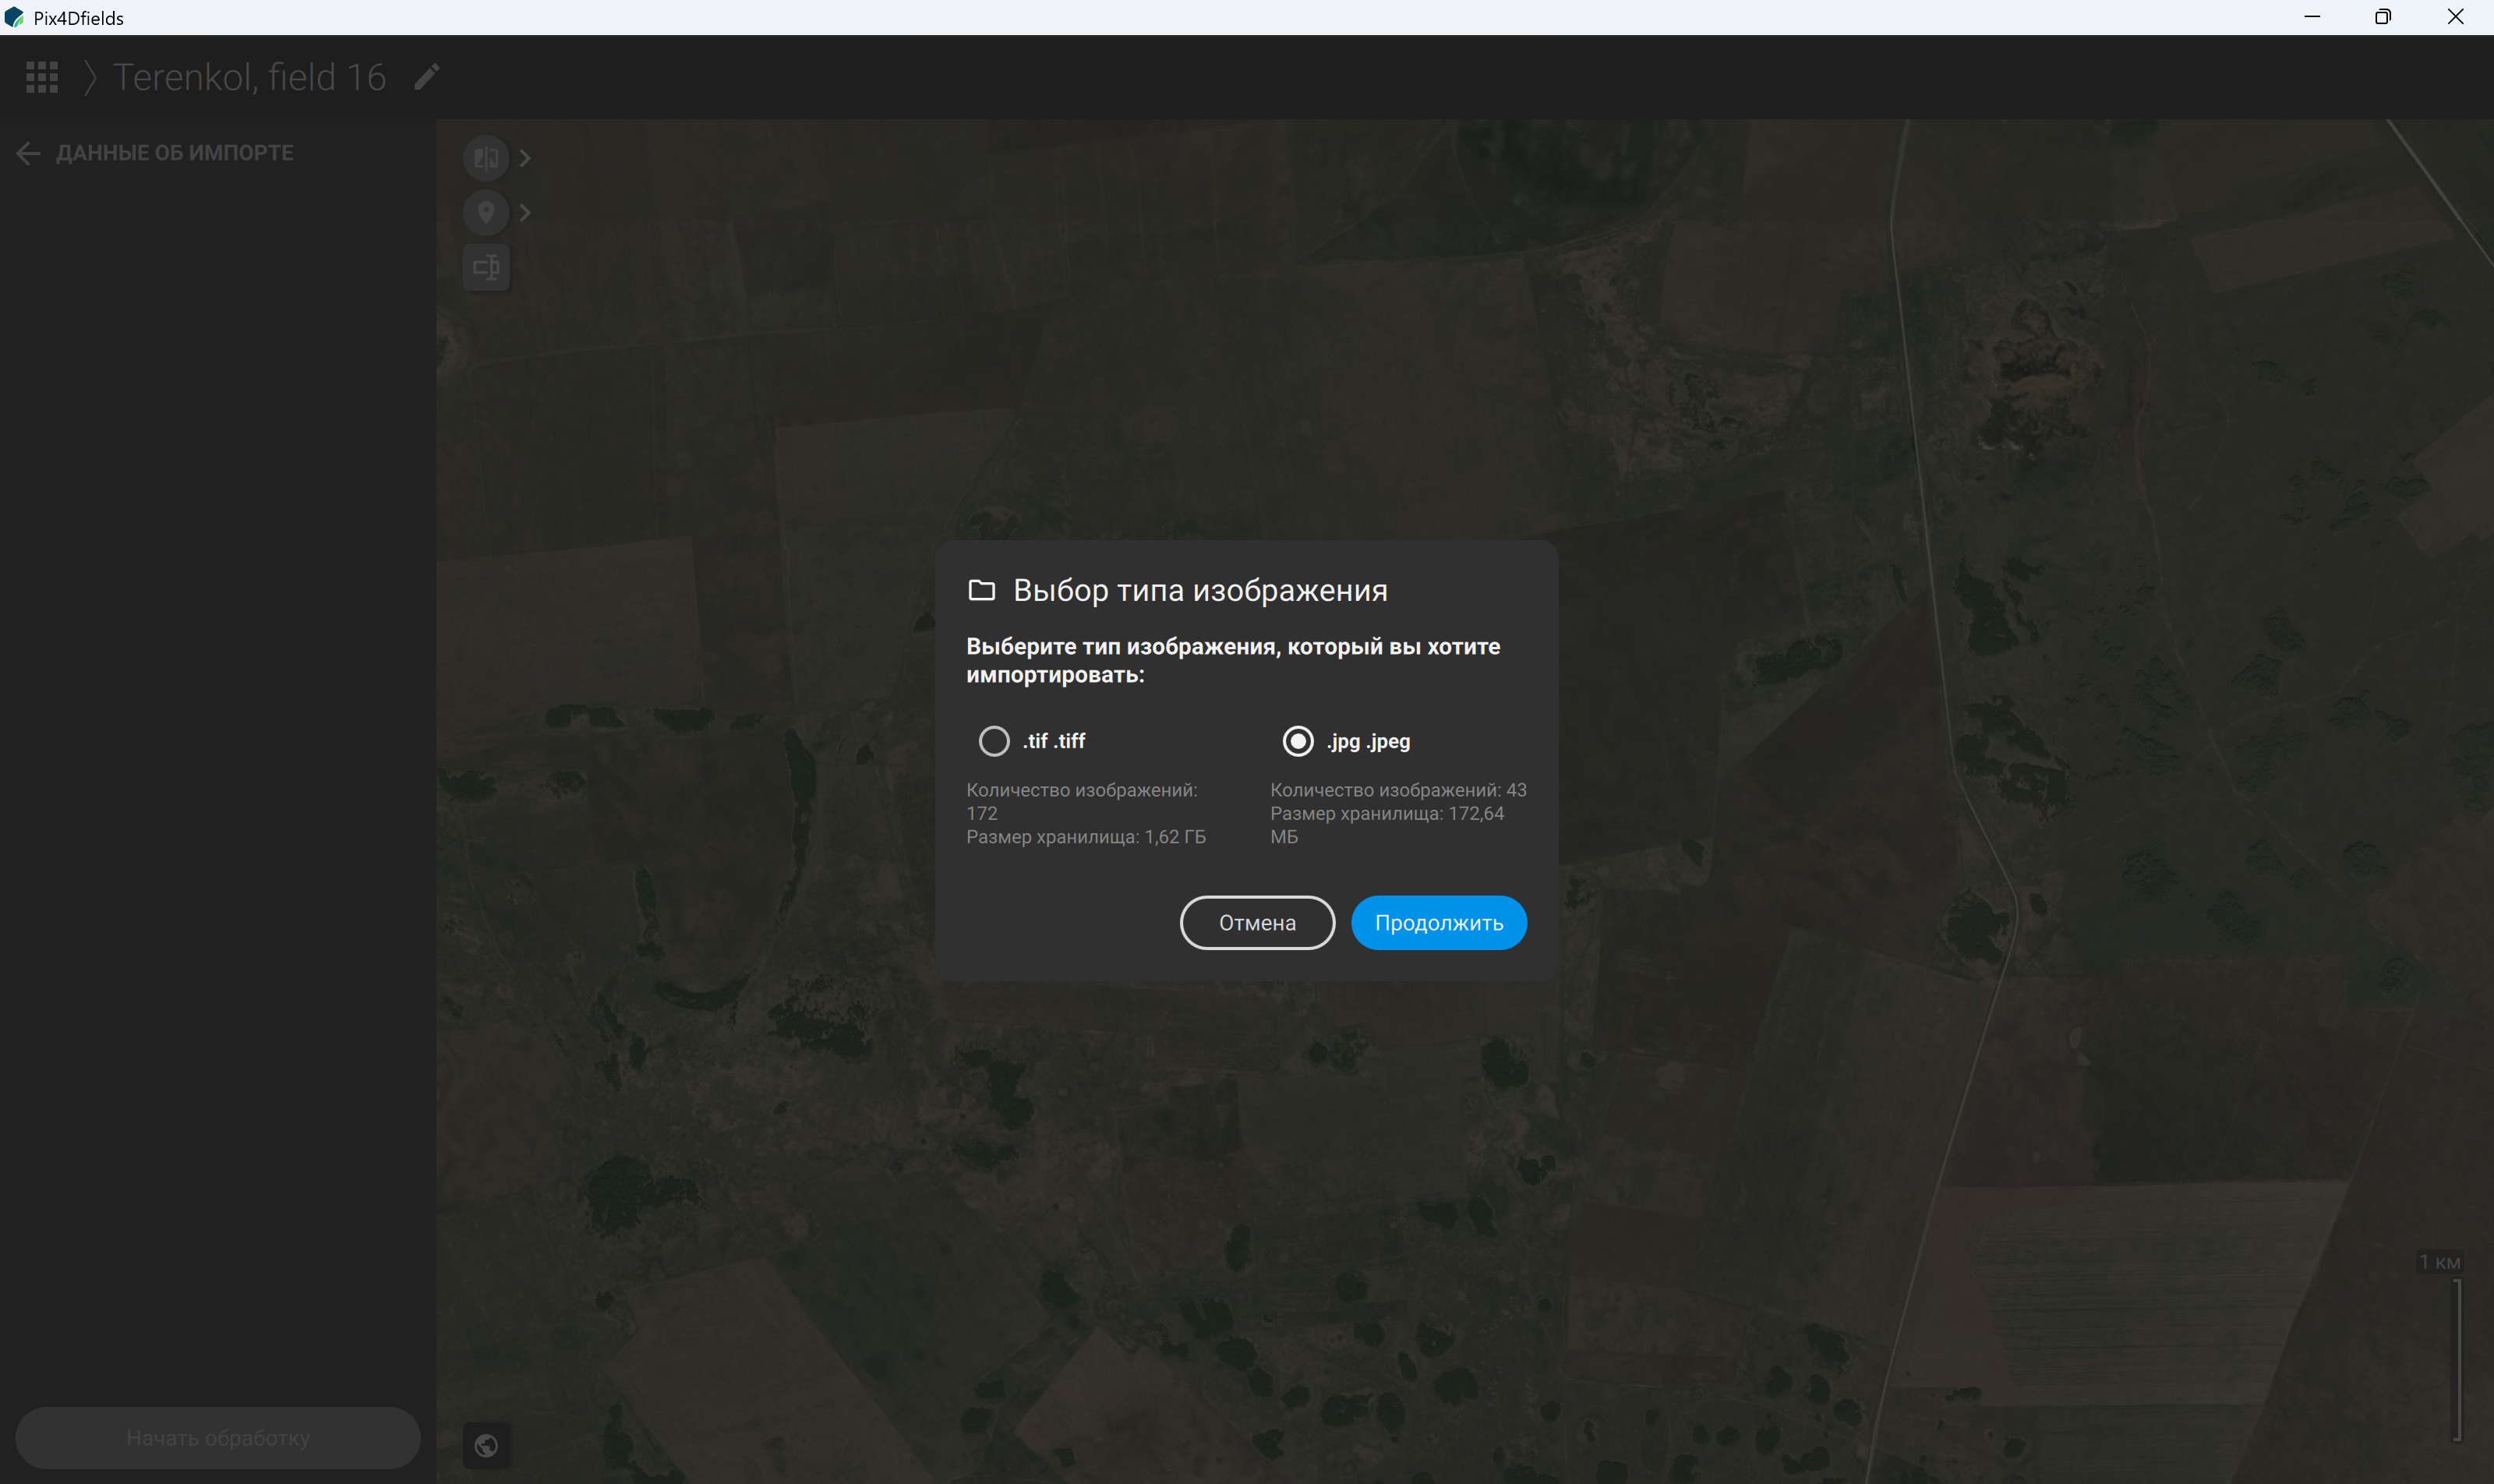
Figure 44 – Selecting the type of imported images: standard RGB images in “.jpg” or “.jpeg” format
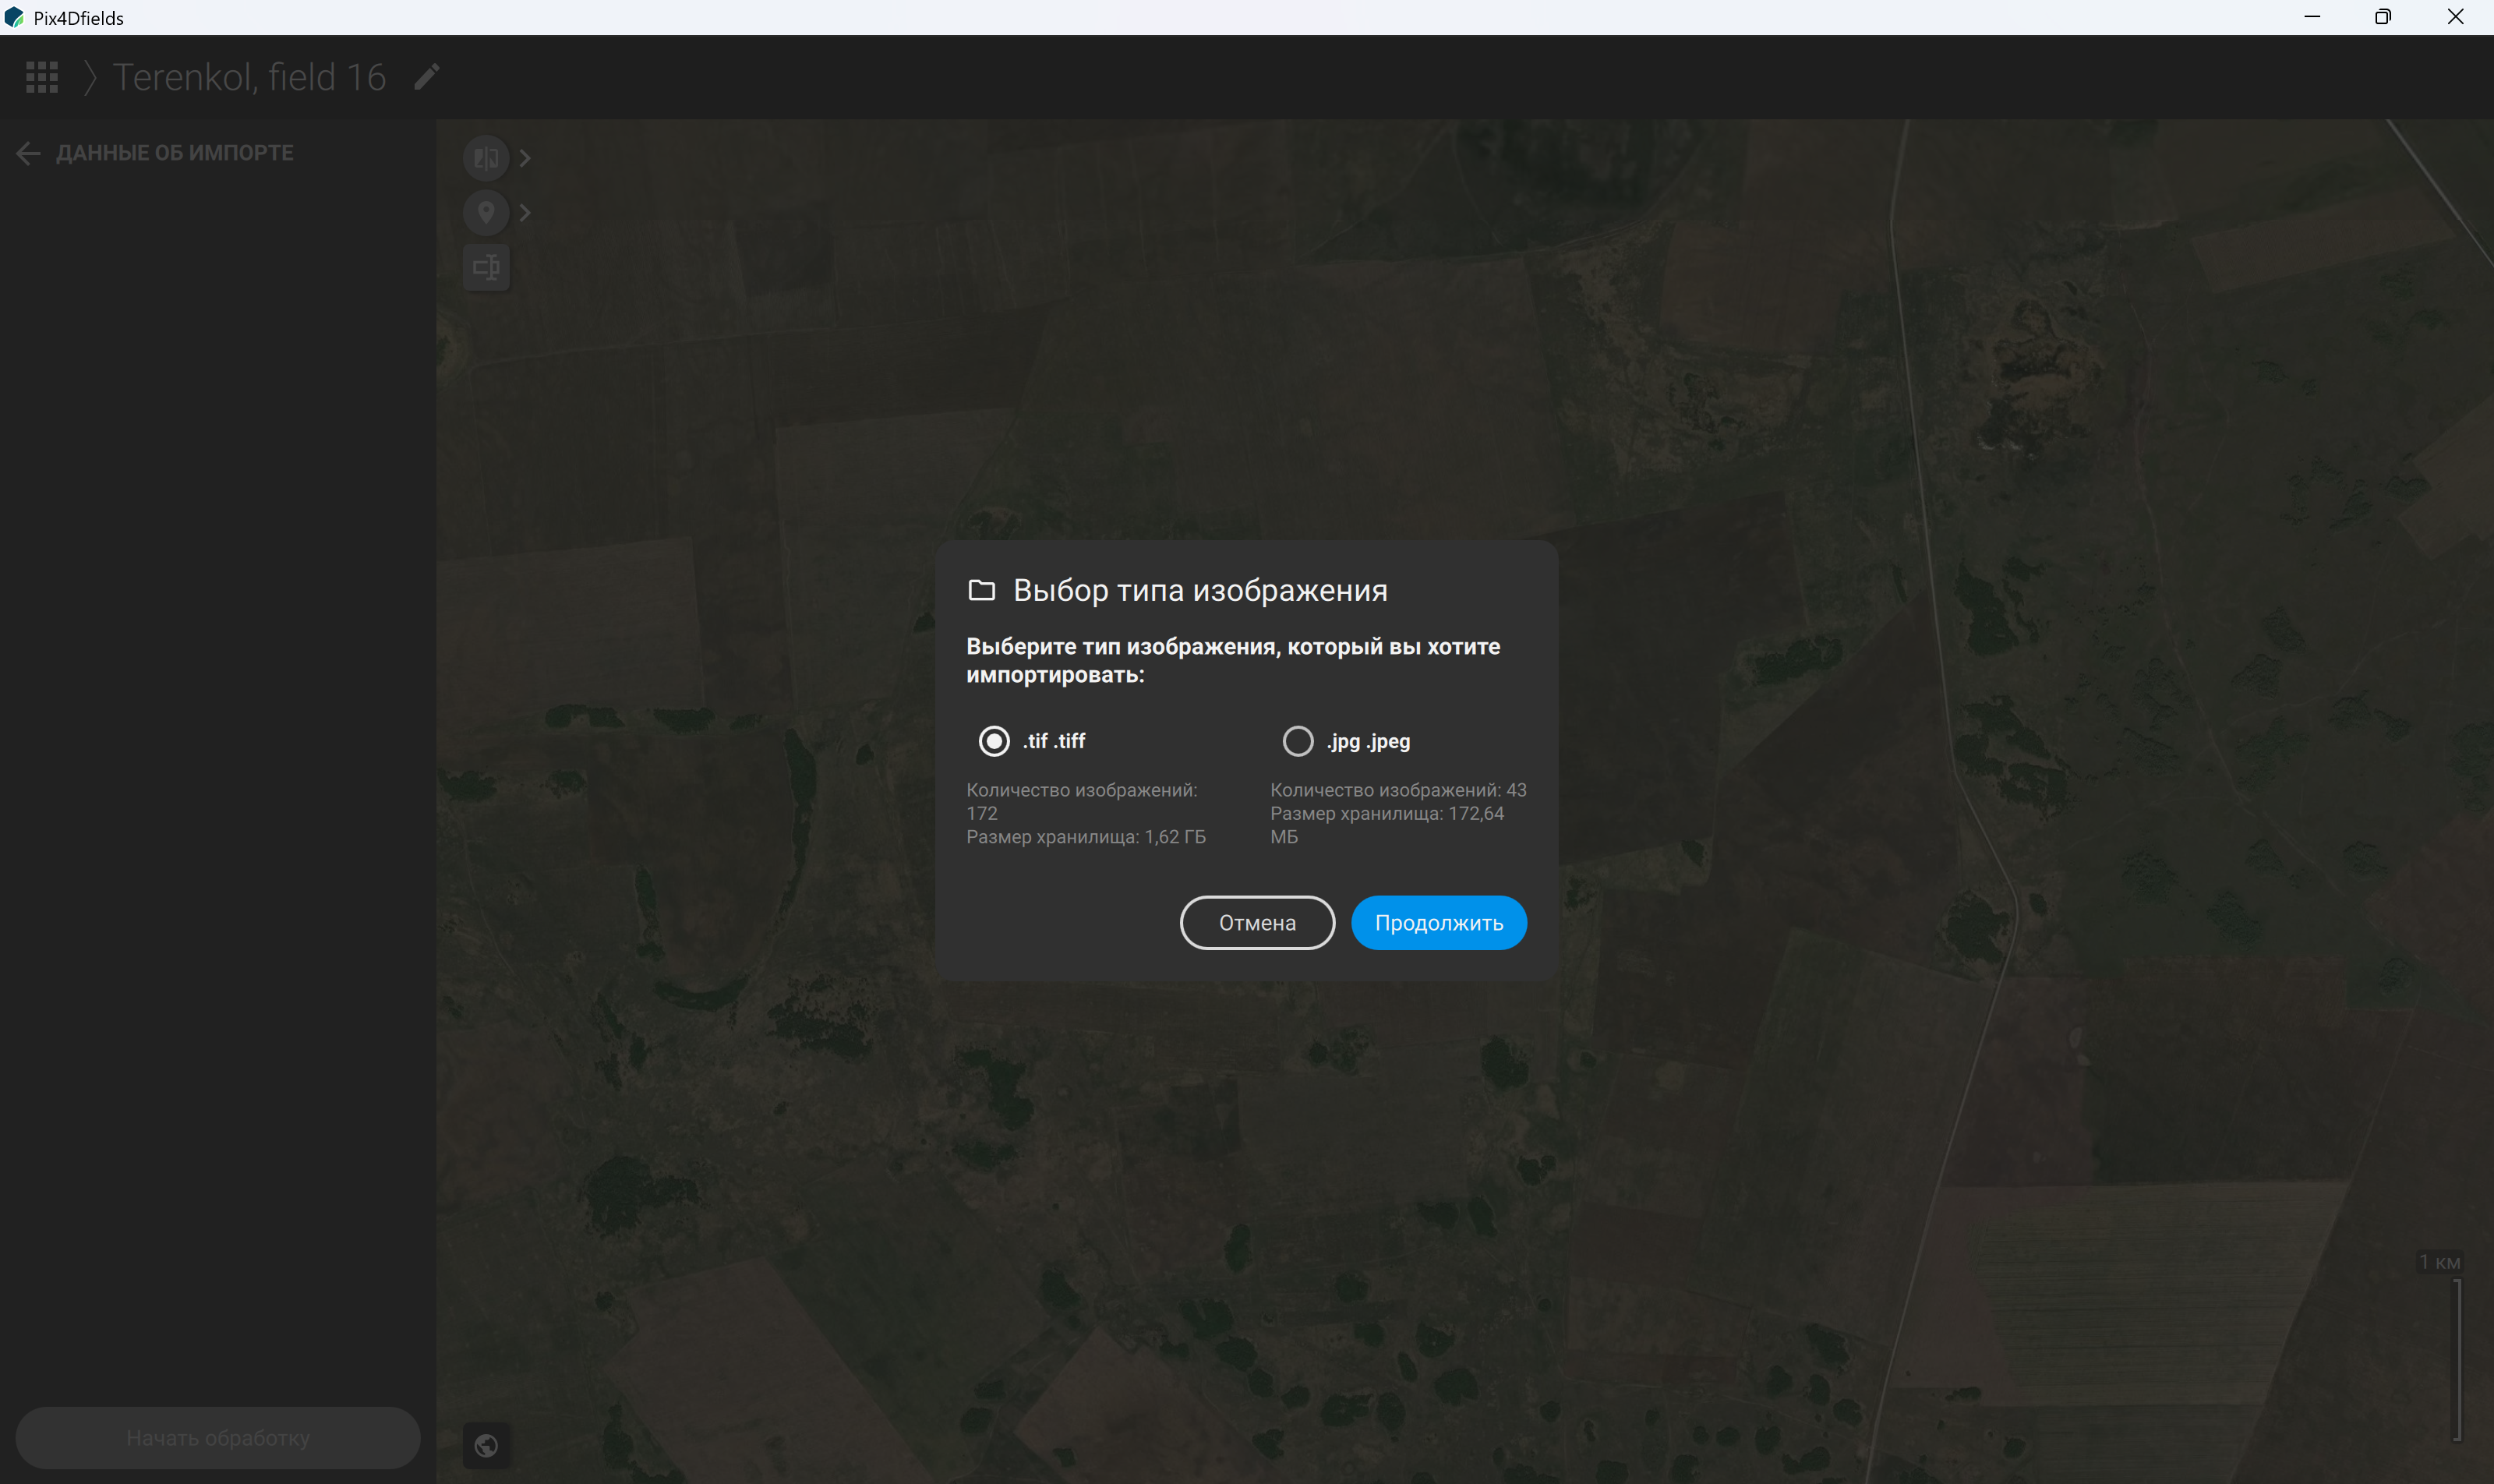
Figure 45 – Selecting the type of imported images: multispectral images in “.tif” or “.tiff” format
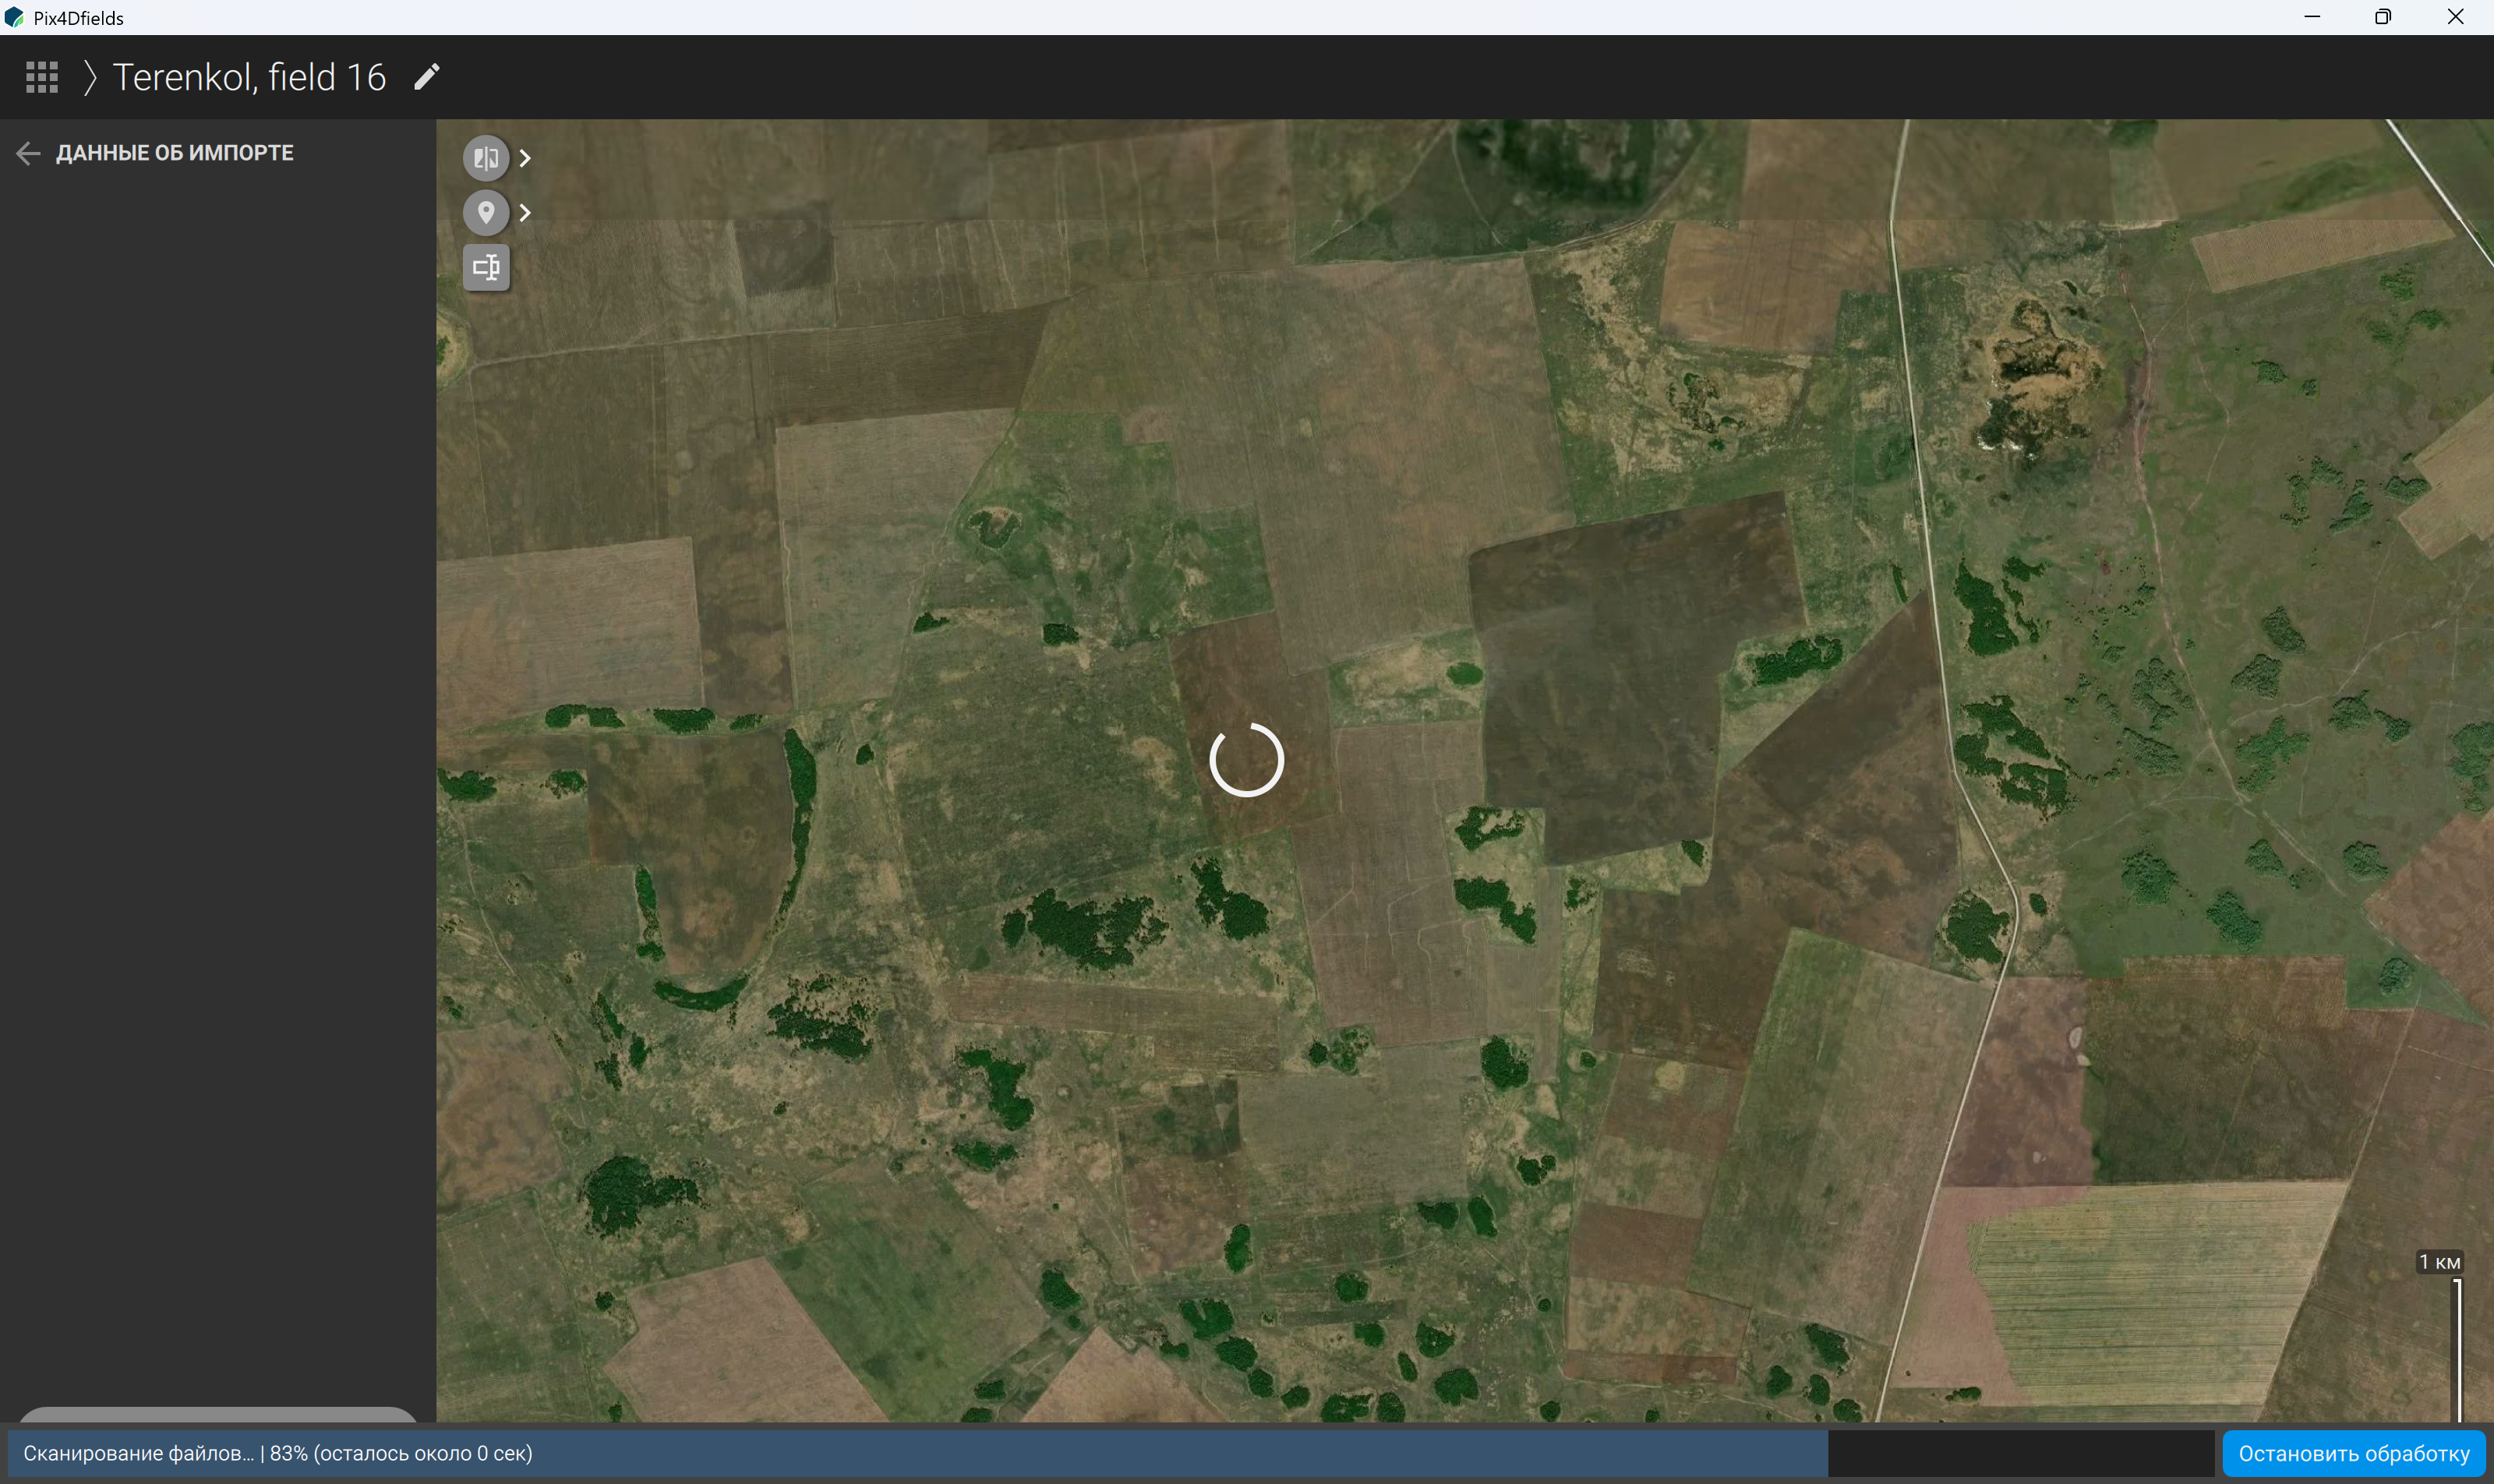
Figure 46 – Scanning and loading imported files
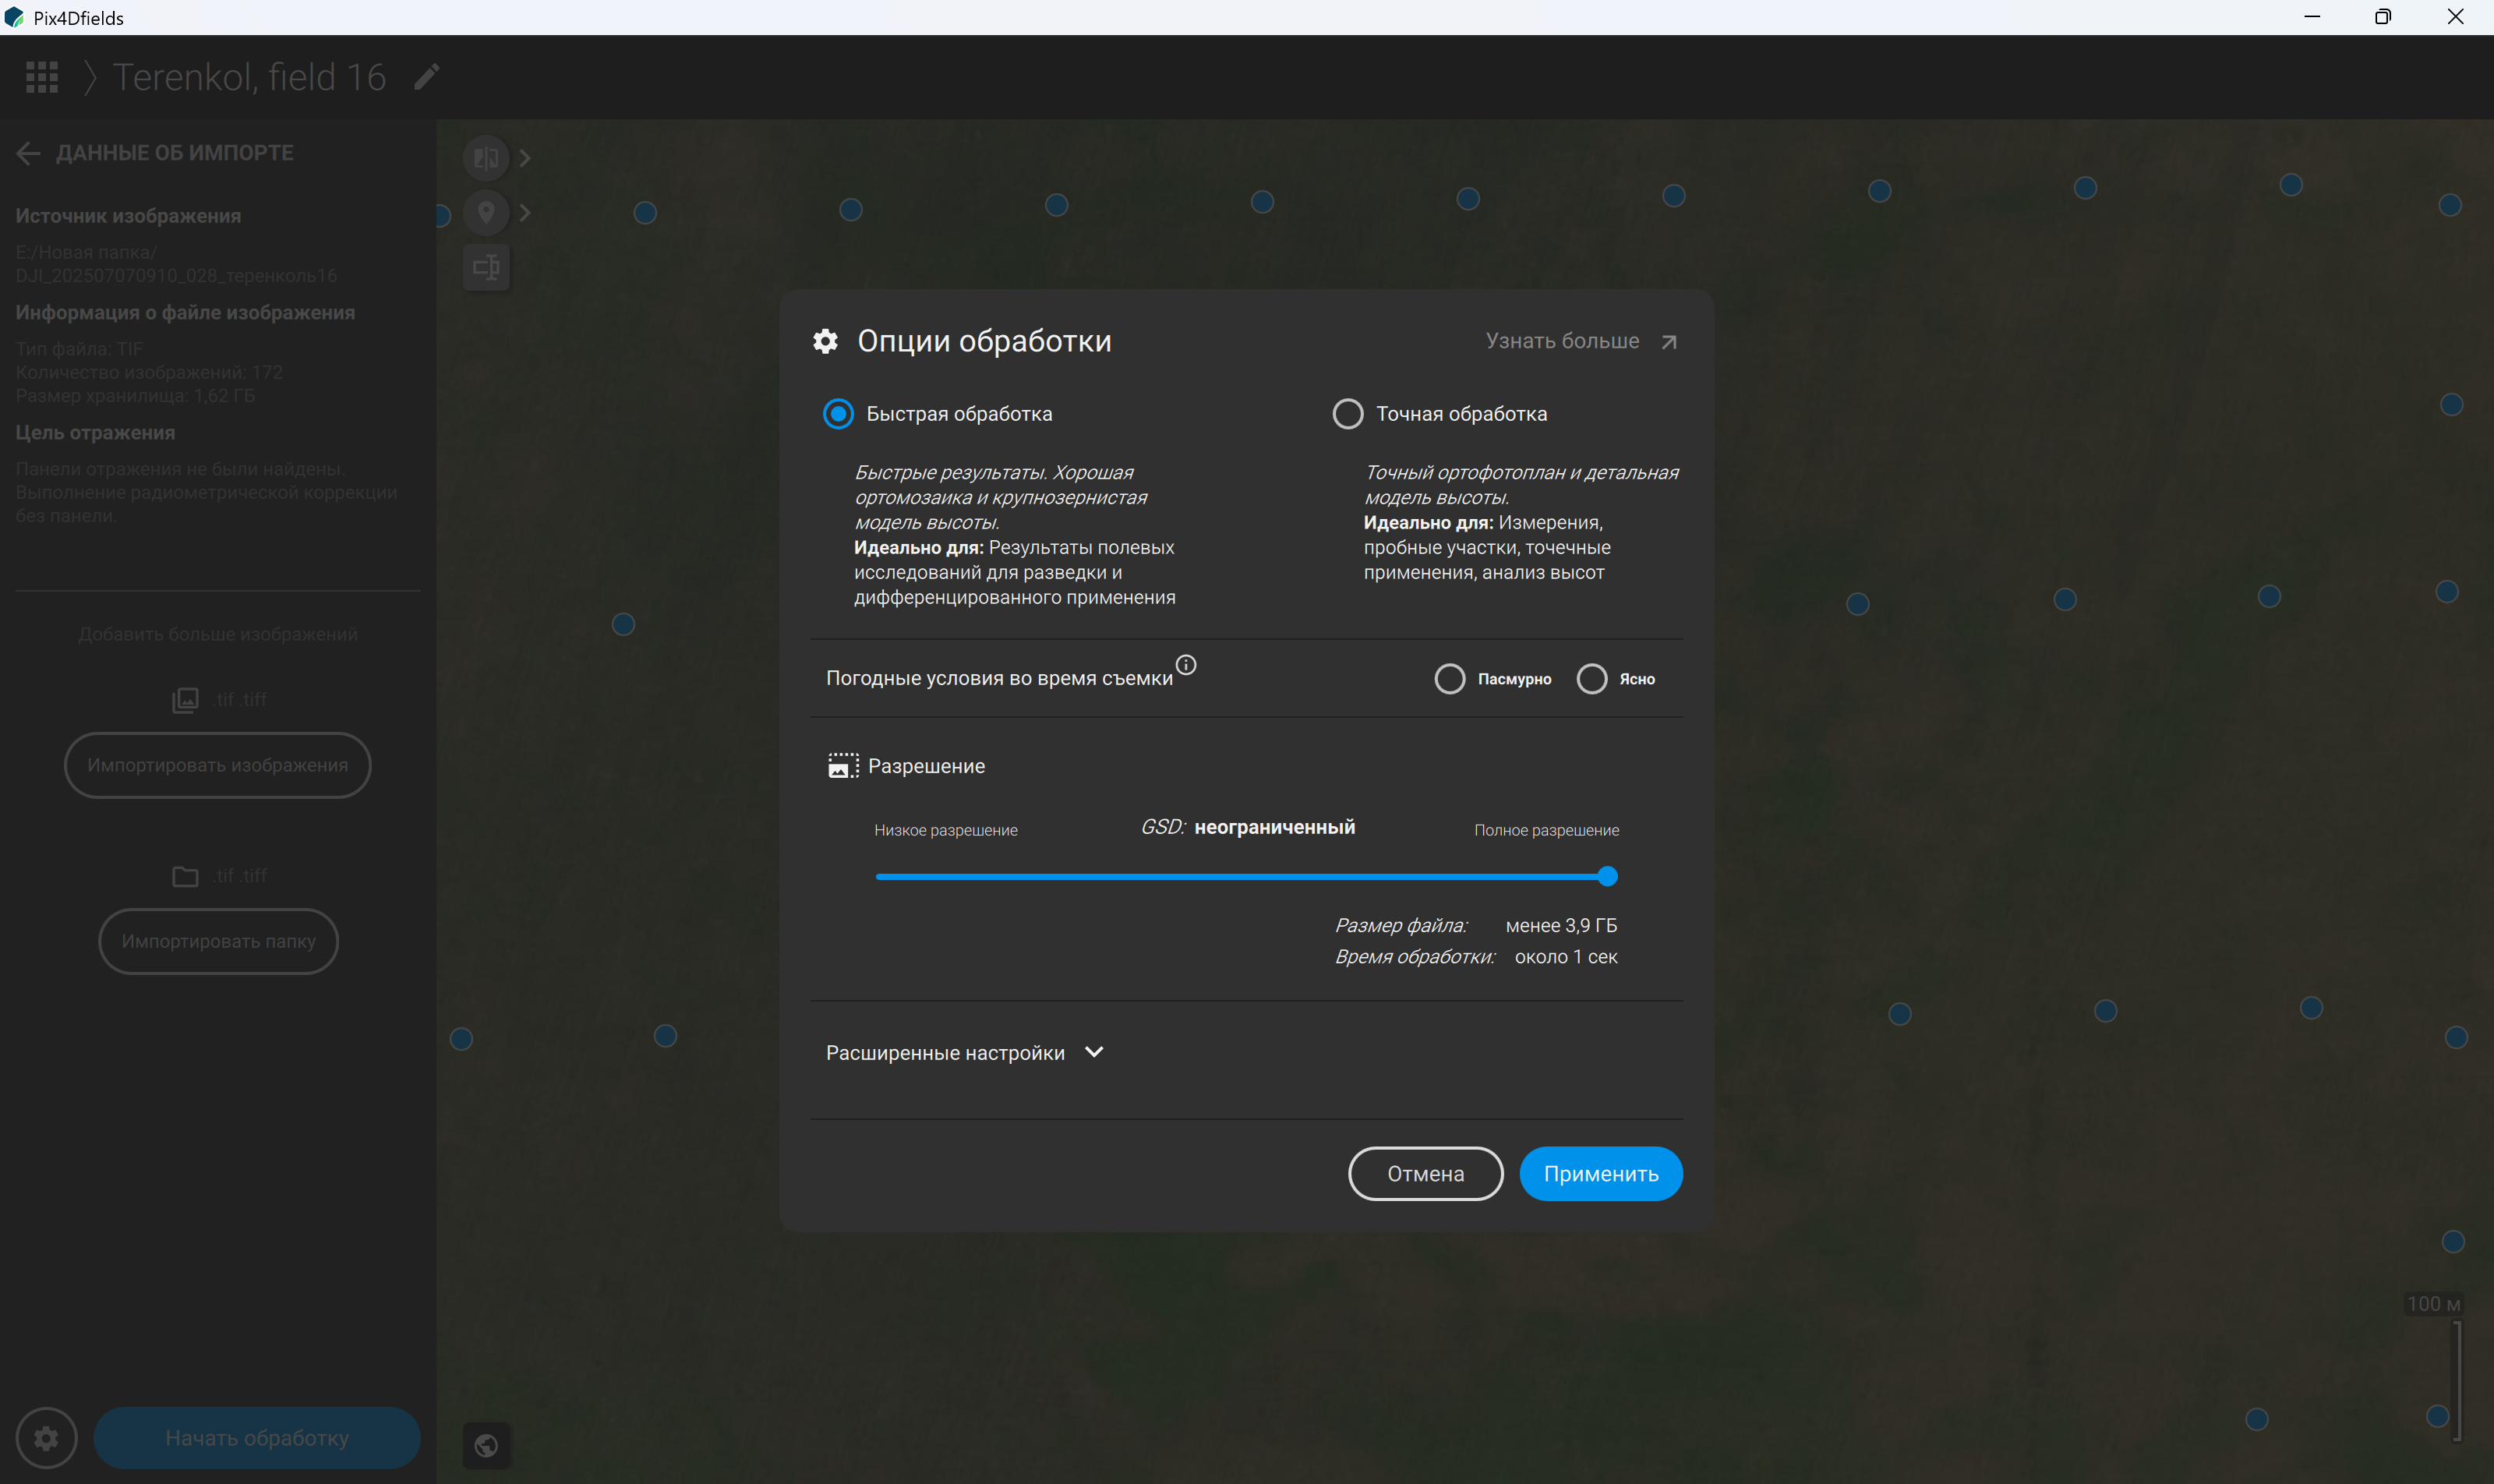
Figure 47 – Selecting image processing options: “Fast Processing”
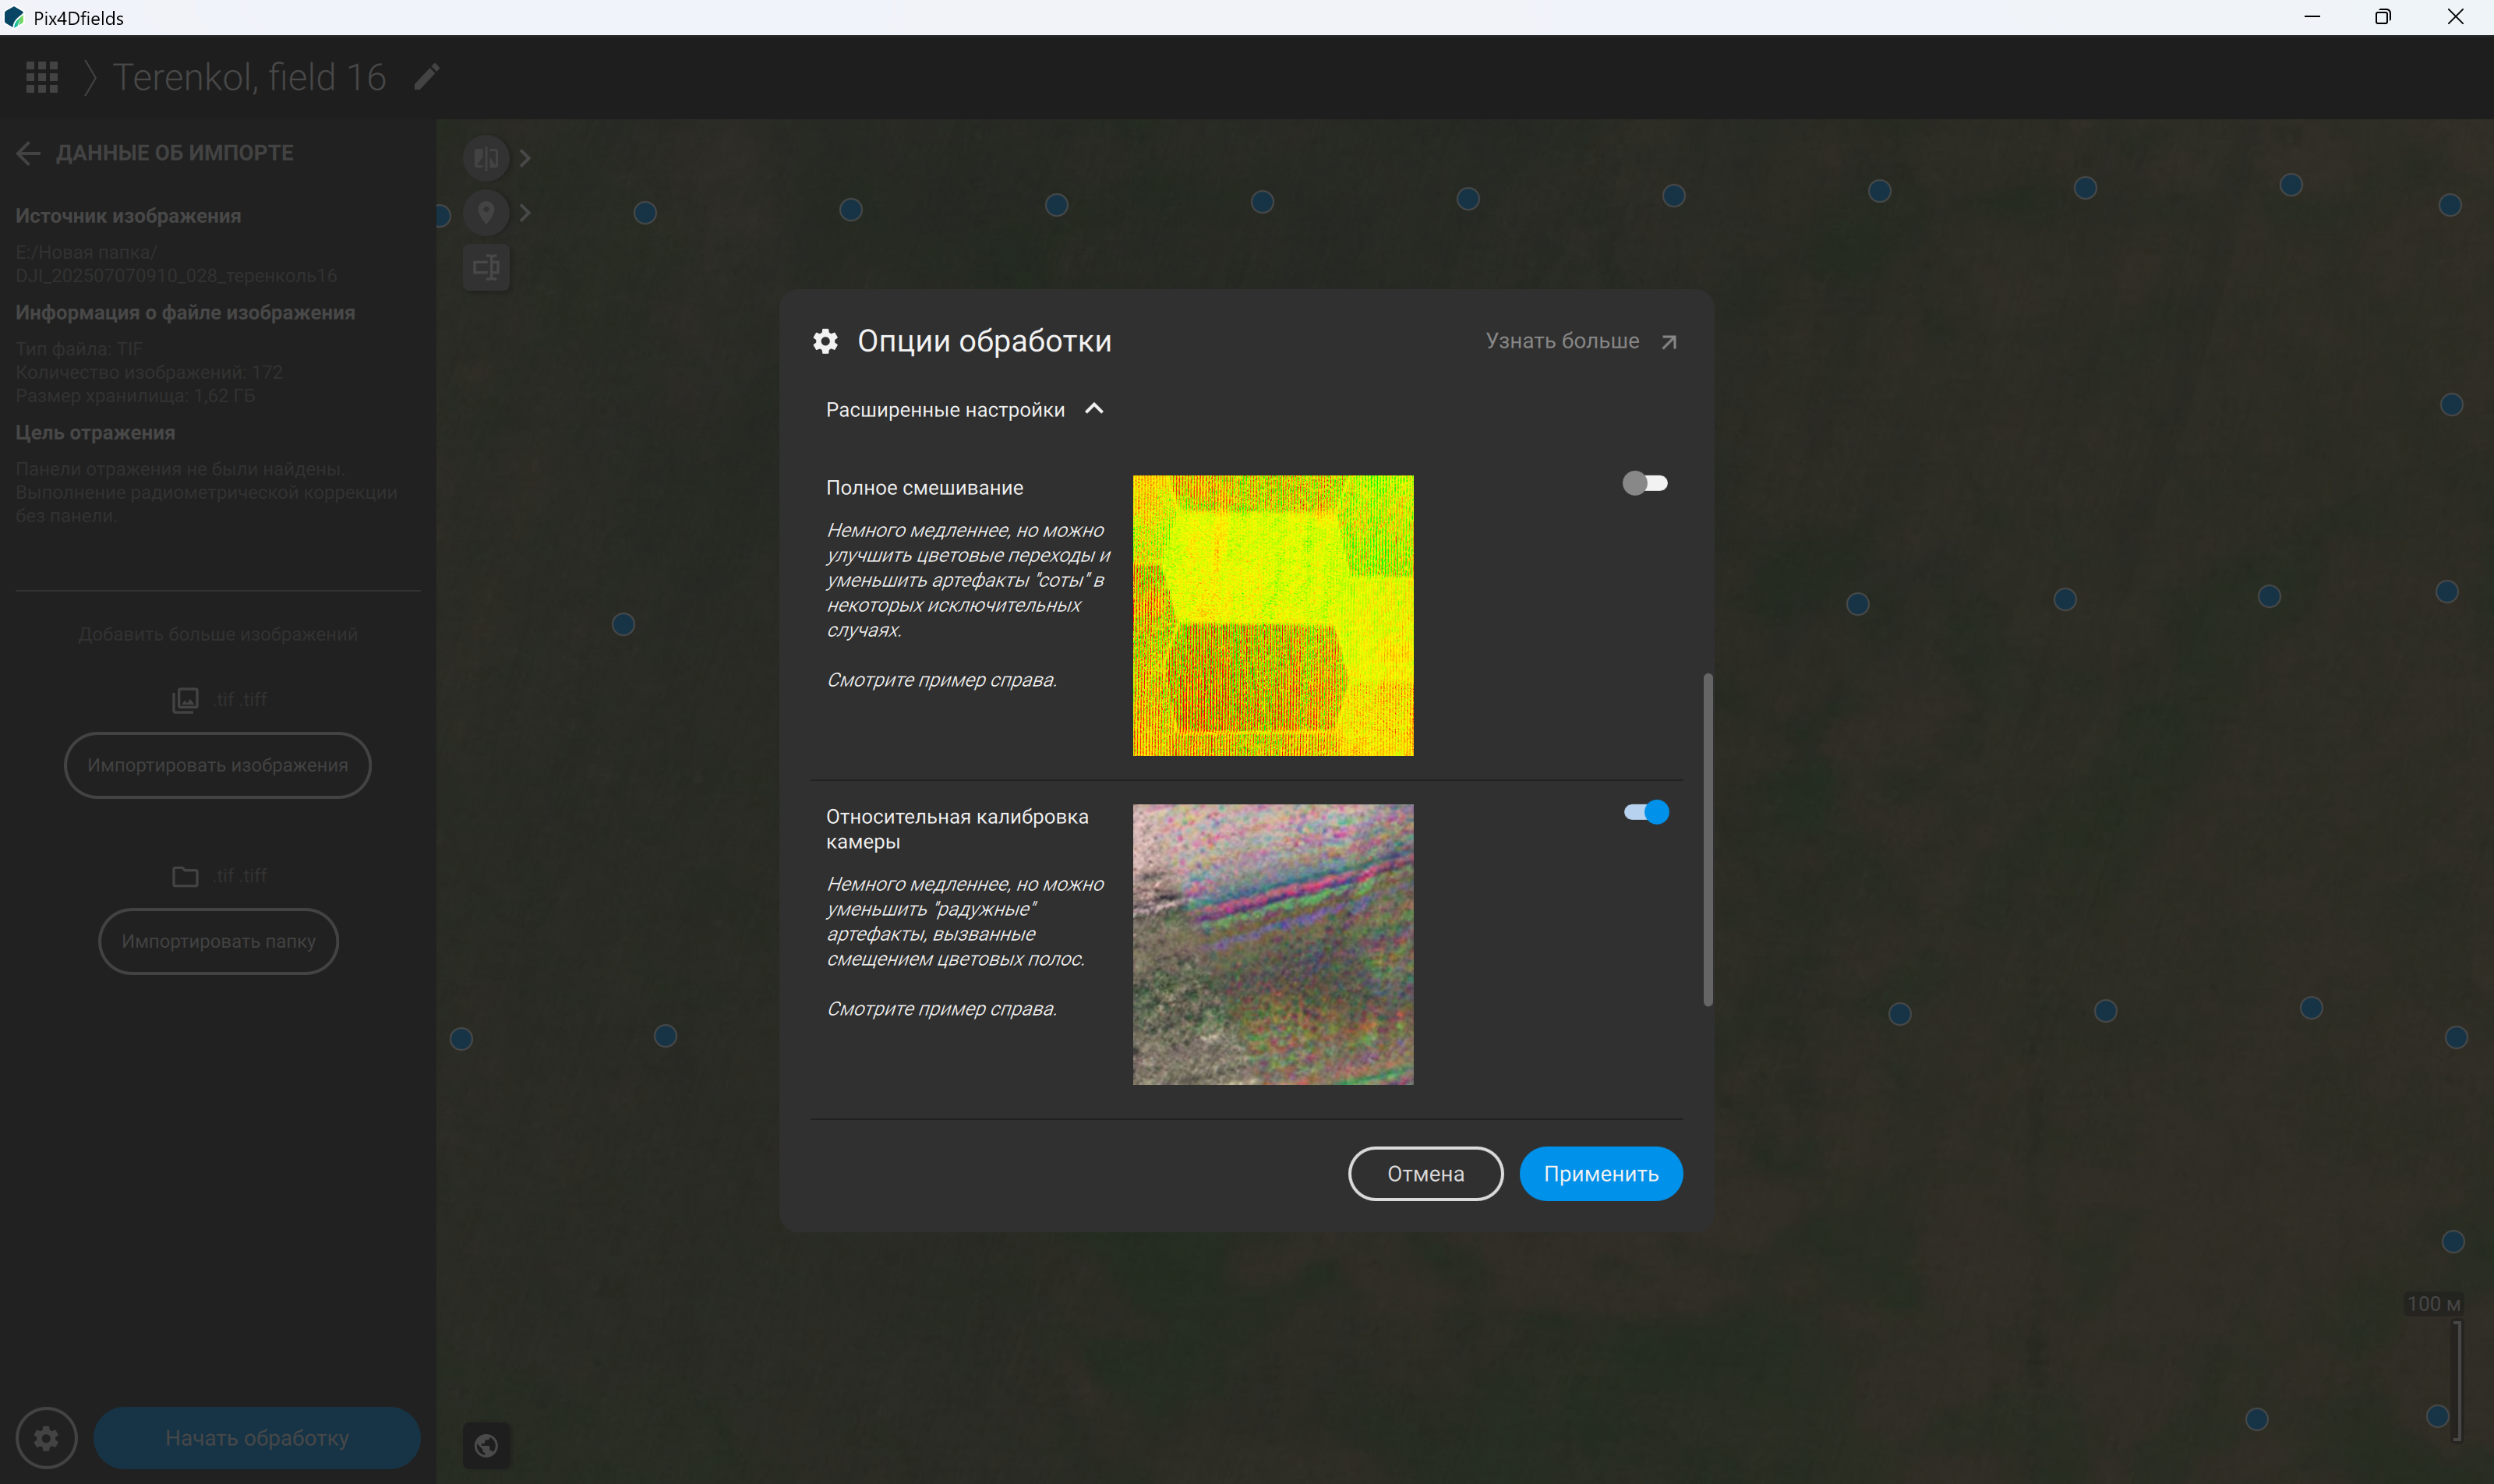
Figure 48 – Selecting image processing options: relative camera calibration in “Fast Processing” mode
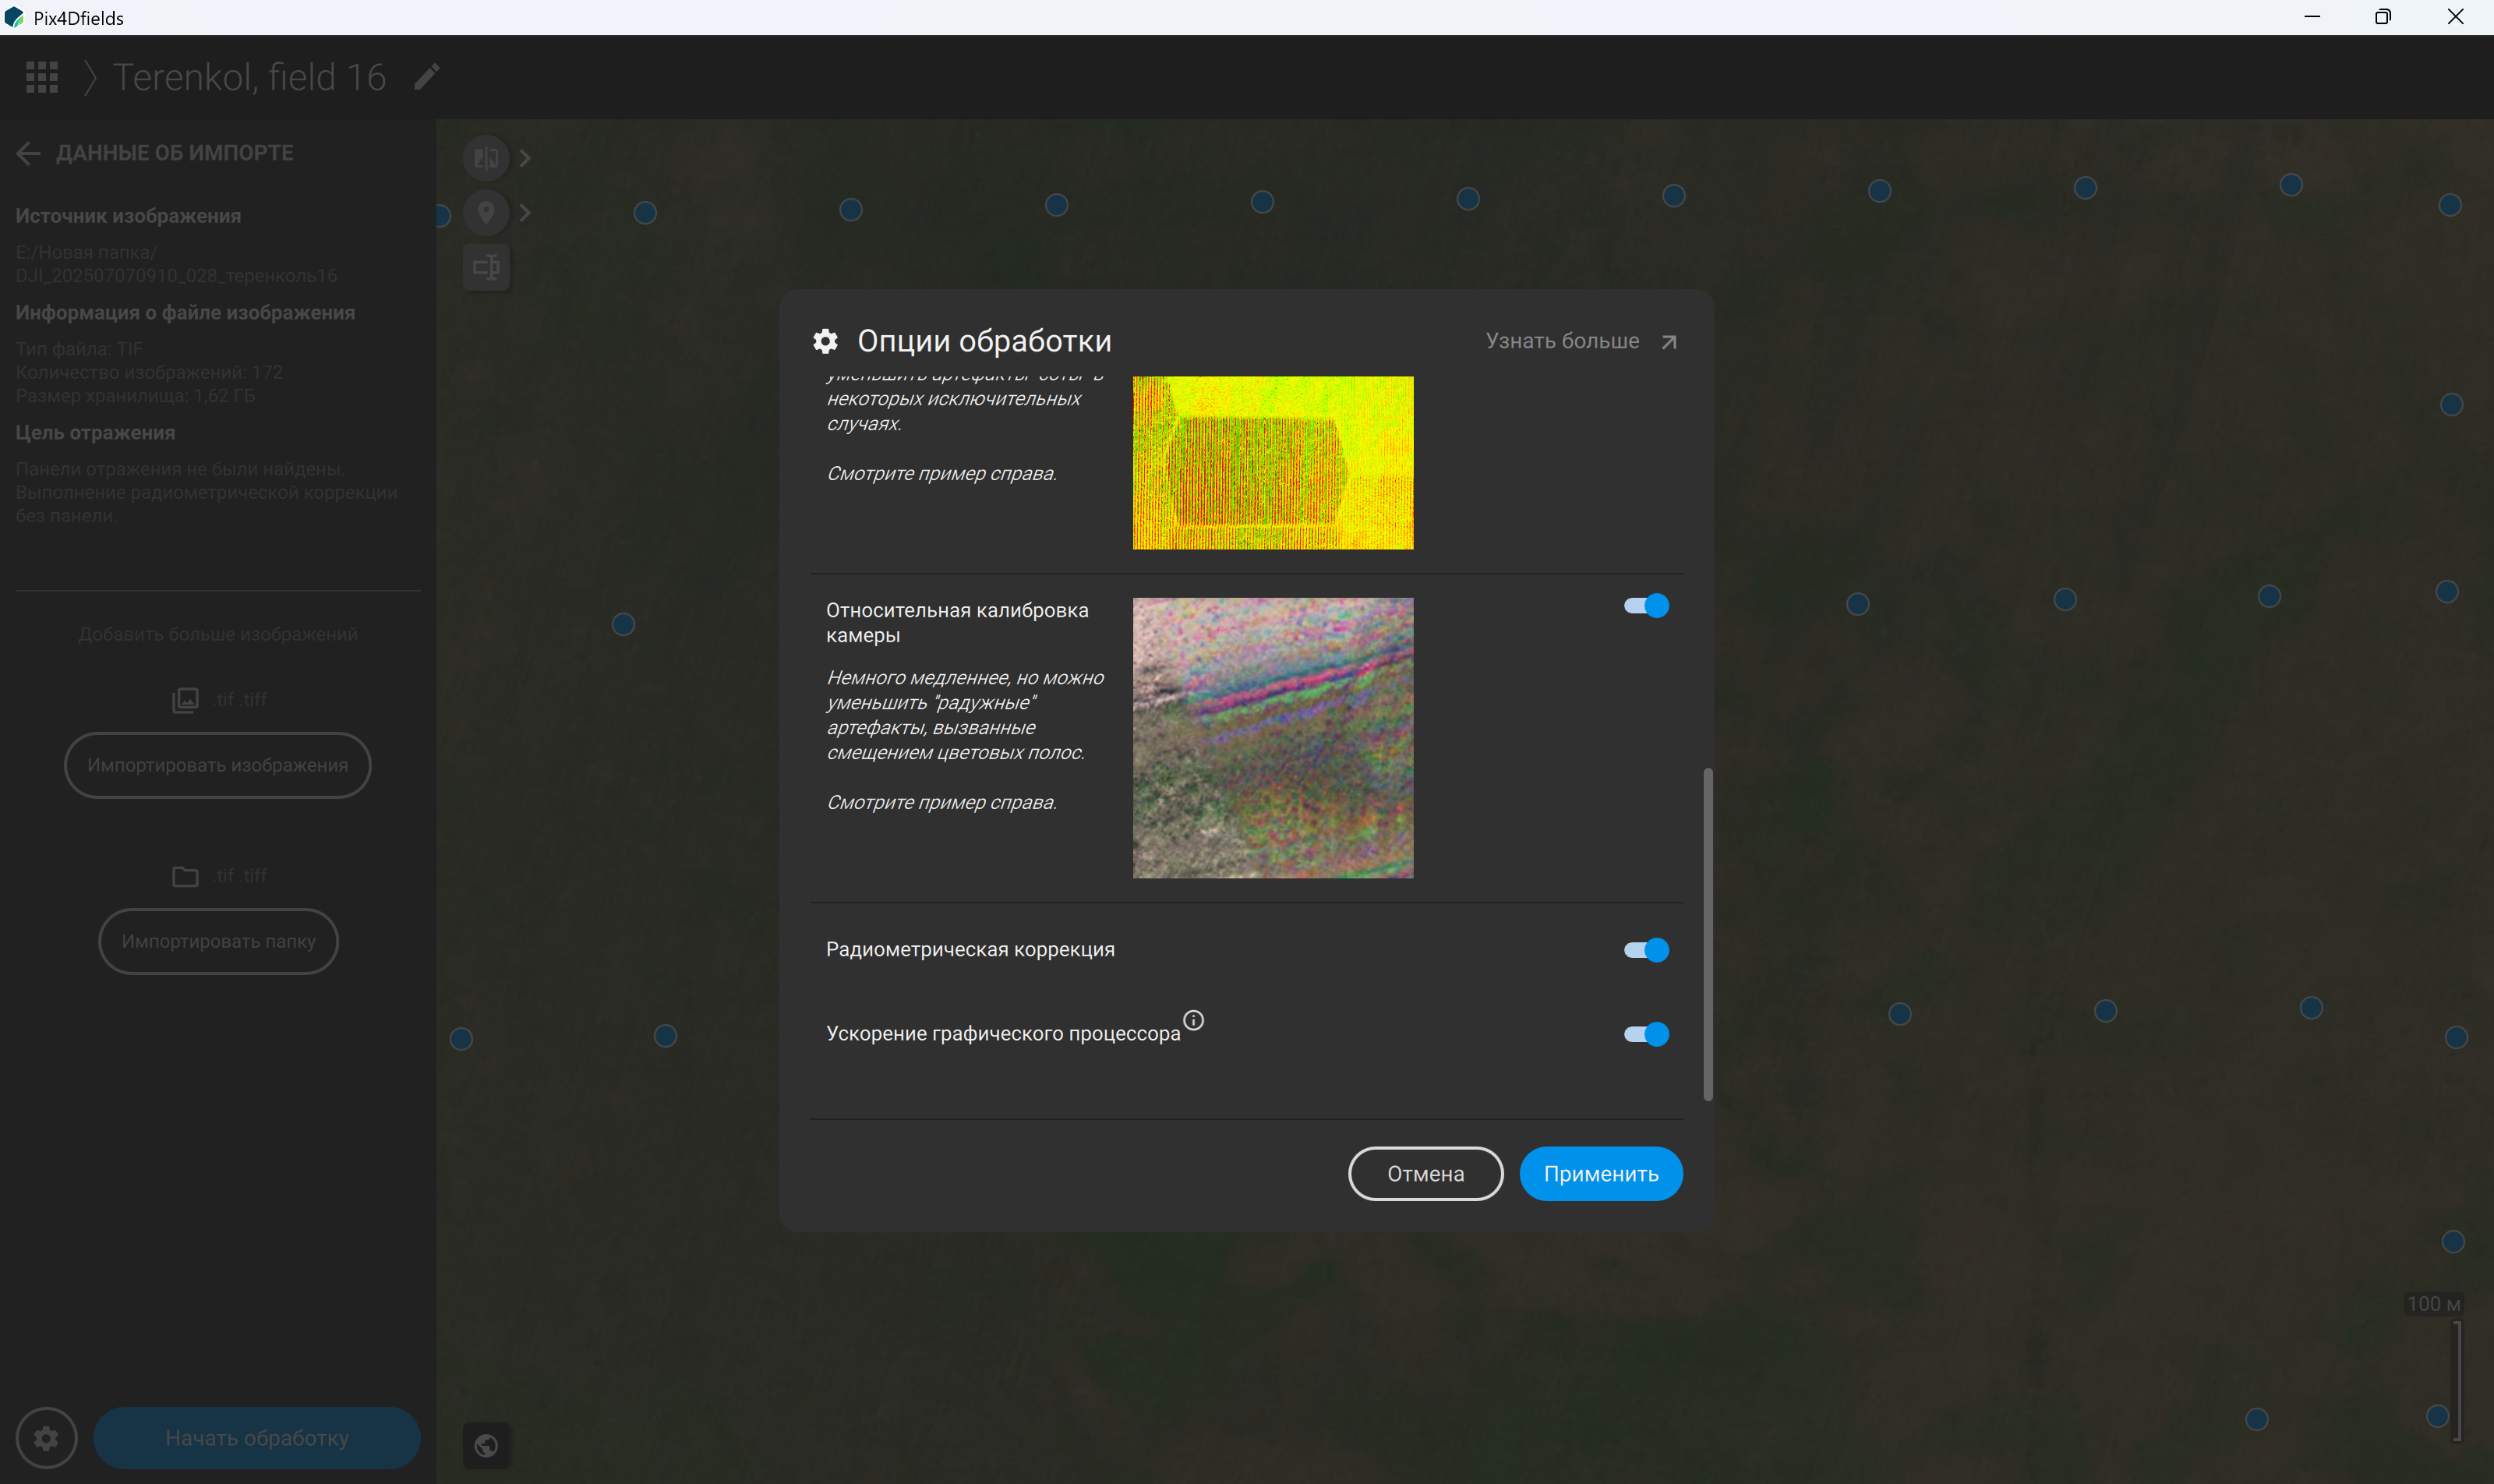
Figure 49 – Selecting image processing options: radiometric correction and GPU acceleration settings in “Fast Processing” mode
The “Accurate Processing” mode (Figure 50) is designed to produce orthomosaics and surface models with a high level of detail. It is particularly suitable for processing individual sample plots, conducting detailed localised studies, and analysing surface elevation. Depending on the available settings, users can specify the survey conditions and select the required spatial resolution, which determines the ground area represented by each pixel. Additional options are available in the advanced settings, including full data blending, relative camera calibration, and radiometric correction (Figure 51). Once the required parameters have been configured, the user must click “Apply” to confirm the settings (Figure 51).
After the images have been selected or additional files have been added, the user can initiate the workflow by selecting “Start Processing”. Pix4Dfields then analyses the imported dataset. During this stage, the software reads the available image metadata, which may include camera information, GPS coordinates, survey date and time, flight altitude, lens parameters, and information about the available spectral bands. If images of a reflectance calibration panel were acquired during the survey, their availability can also be checked where supported by the selected workflow. The imported dataset is summarised in the “Import Data” section on the left-hand side of the interface. This section provides information about the number of imported images, survey timing, spatial coverage, and other dataset characteristics. For multispectral datasets, the interface may also indicate whether images of a reflectance panel have been detected (Figure 52).
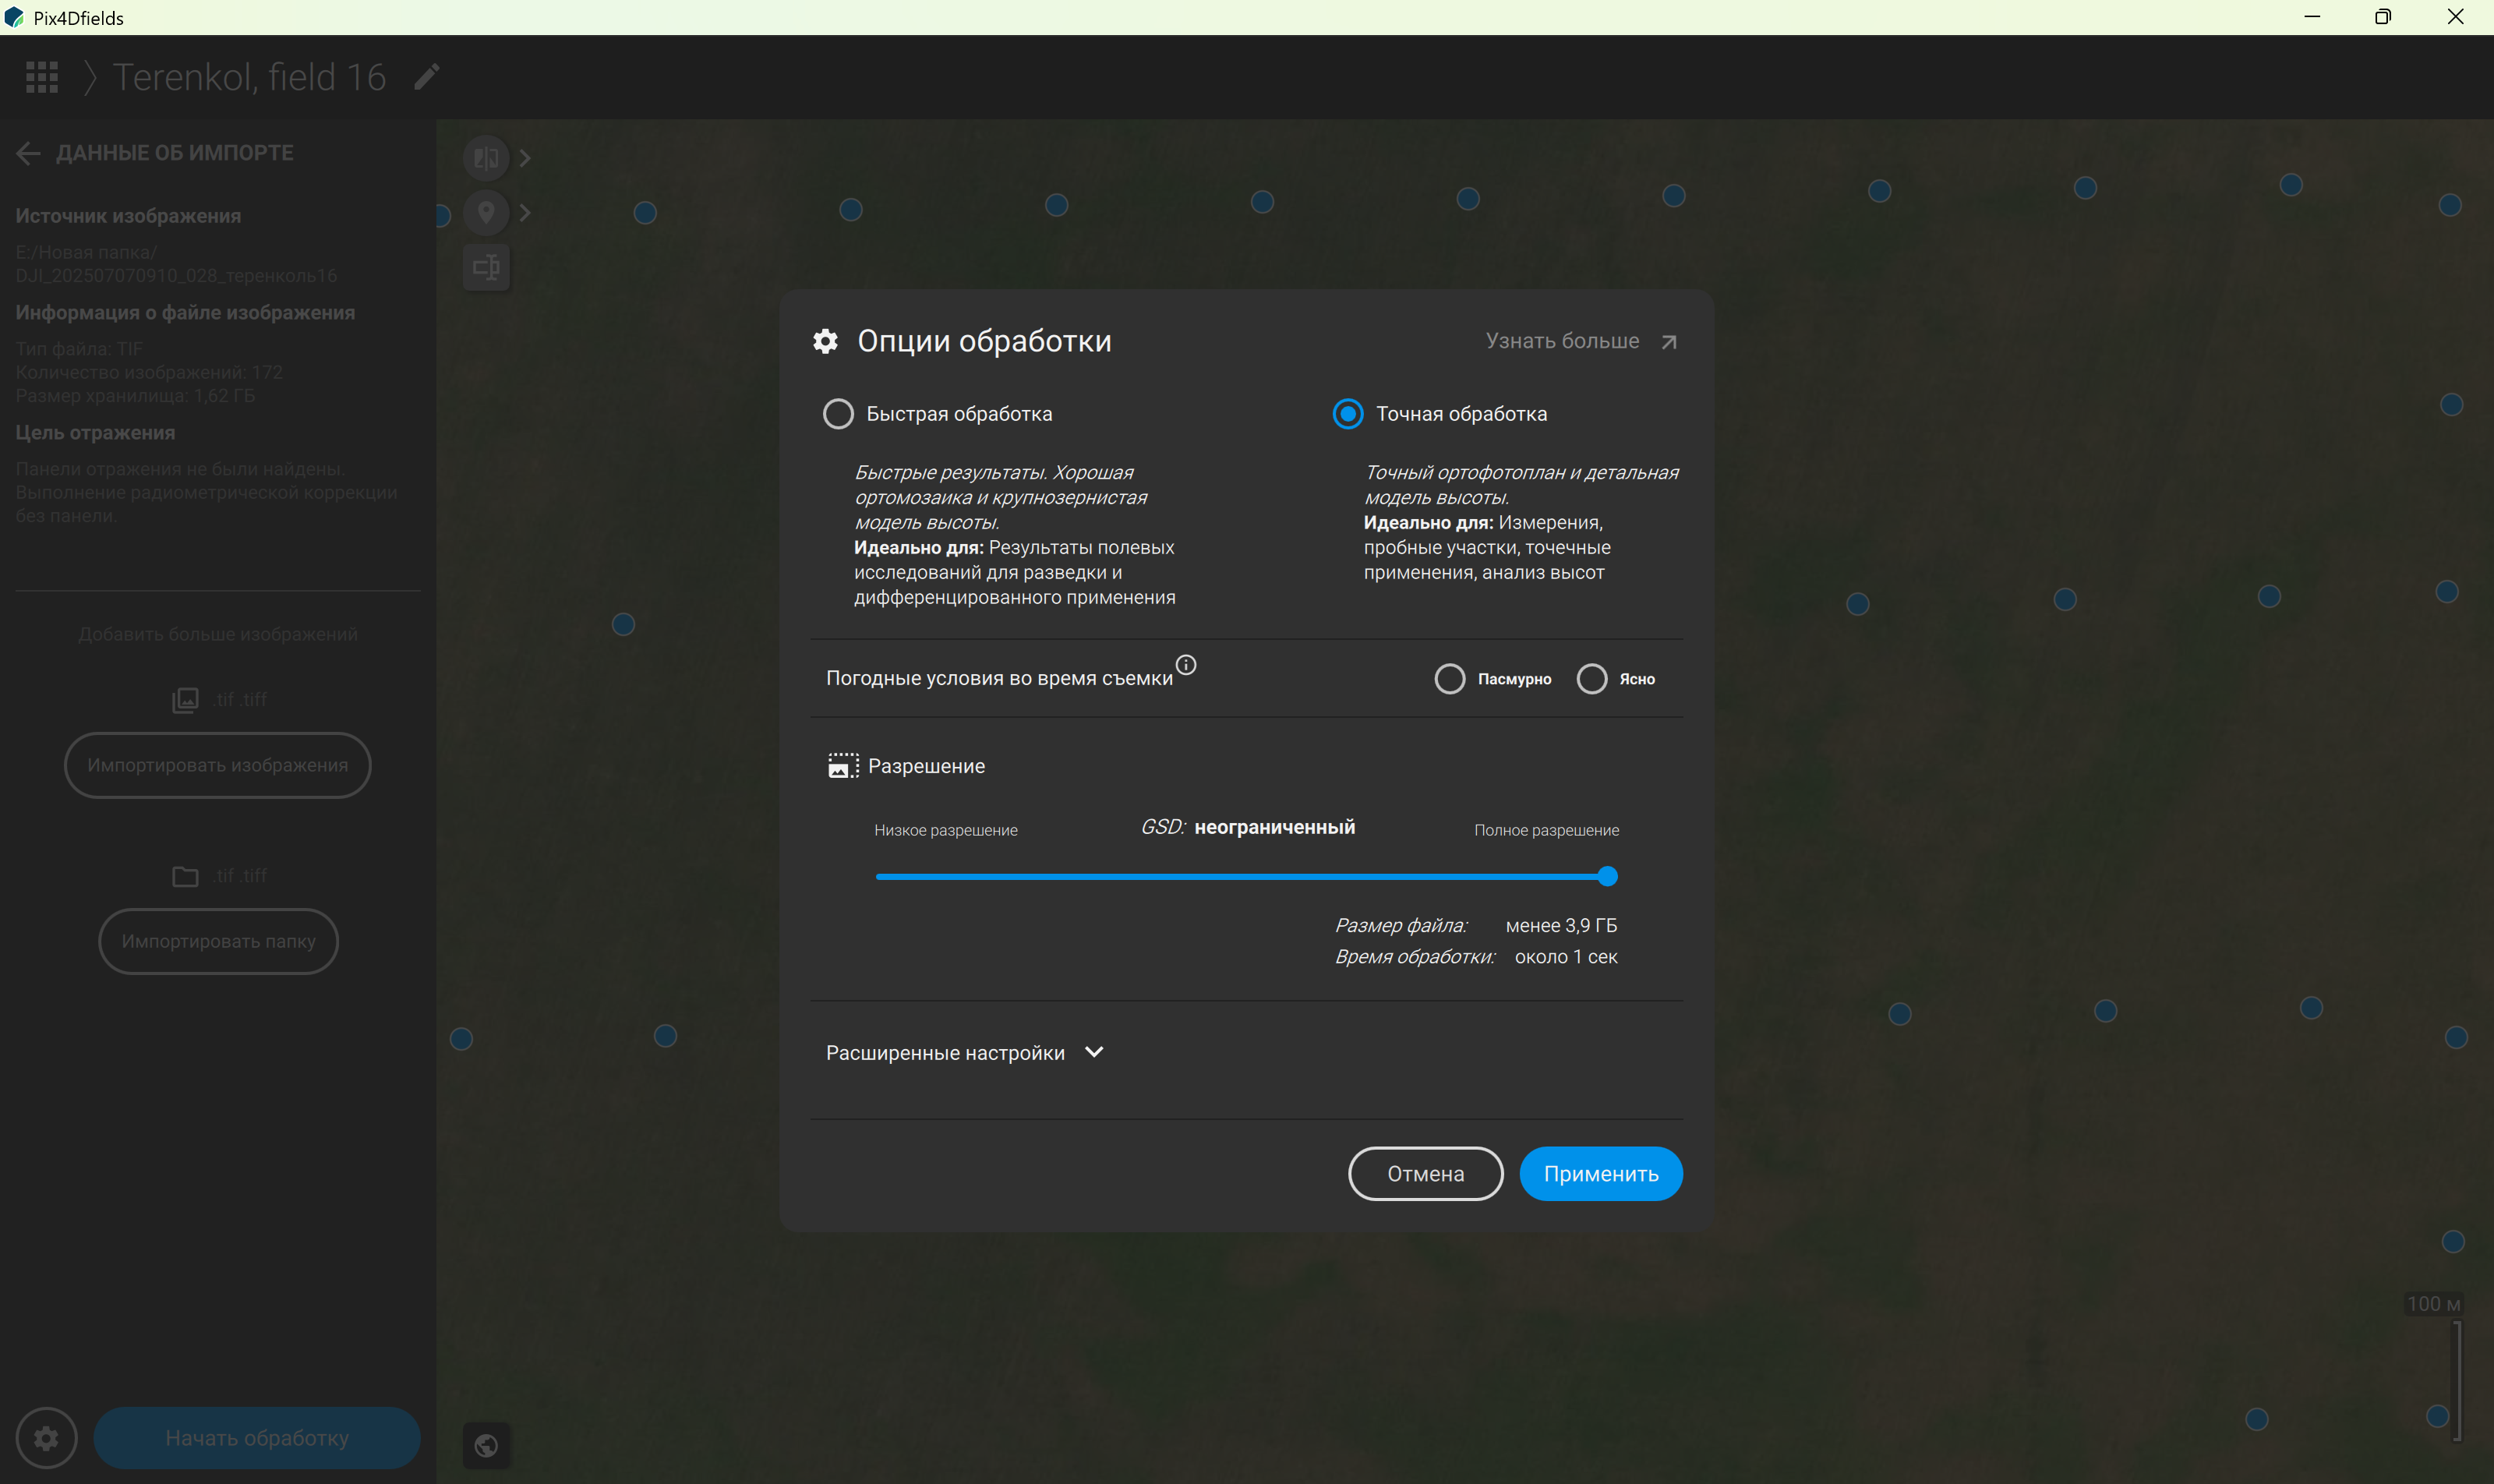
Figure 50 – Selecting image processing options: “Accurate Processing”
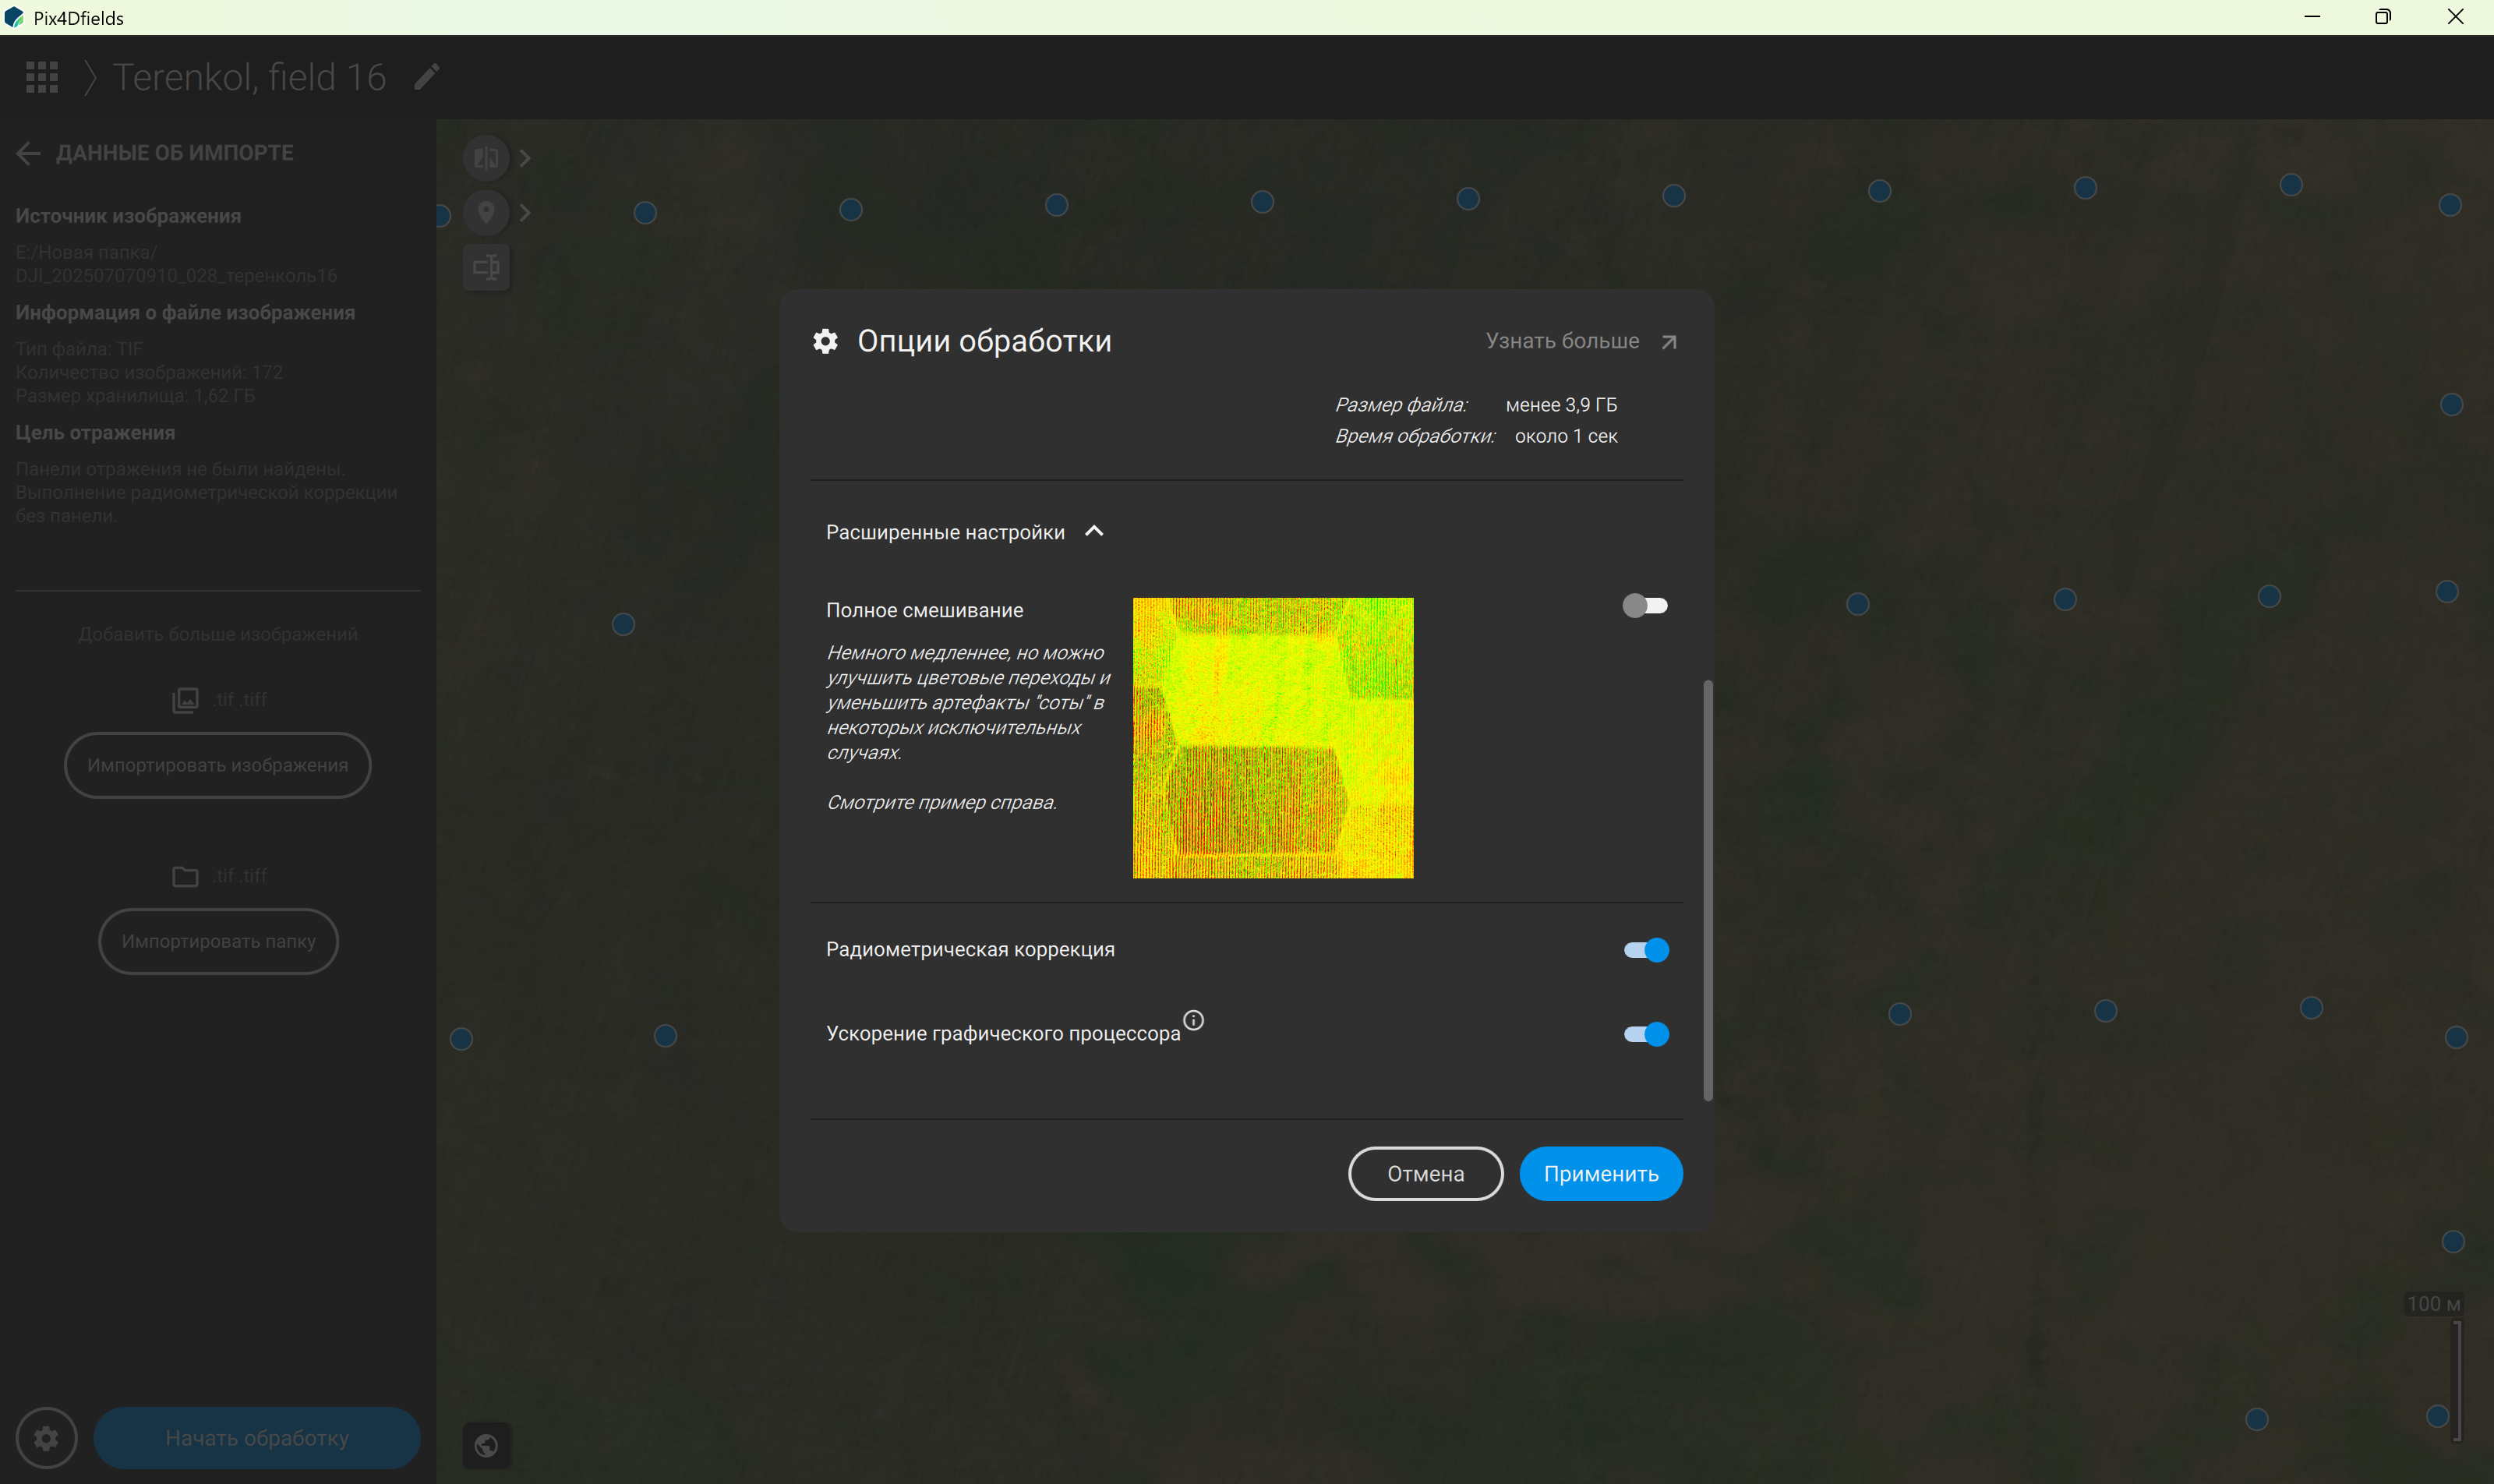
Figure 51 – Selecting image processing options: radiometric correction and GPU acceleration settings in “Accurate Processing” mode
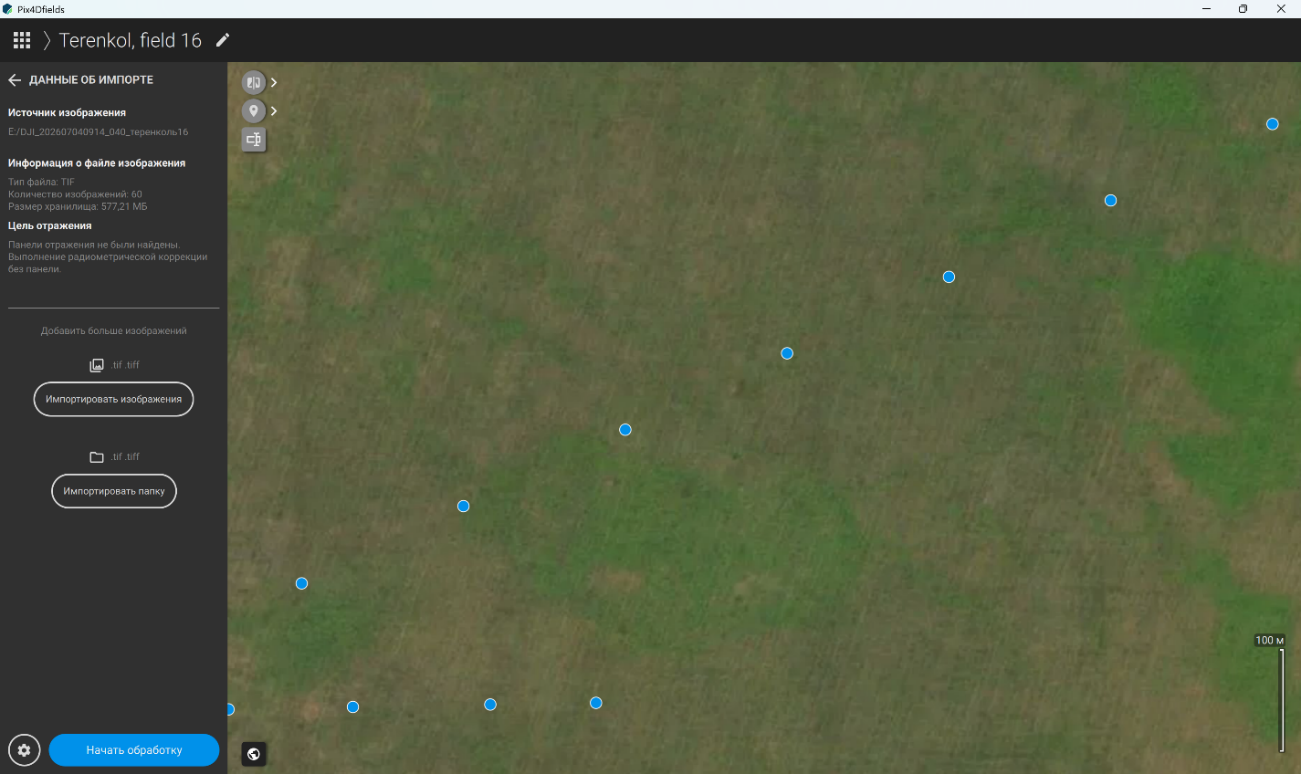
Figure 52 – Commencing the processing of imported images based on the selected mode and settings
Before processing proceeds (Figure 53), the imported data should be checked carefully. The operator should verify that all required images have been imported, that no files are corrupted, that the georeferencing information is valid, and that the images provide sufficient overlap. Image sharpness and exposure should also be assessed, and the availability of all required spectral bands should be confirmed.
Particular attention should be paid to image quality. Blurred images, excessive glare, and incorrect exposure can compromise the quality of the resulting orthomosaic and affect the reliability of subsequent spectral index calculations. Once these checks have been completed, the dataset is ready for the next stage: orthomosaic generation.
In summary, the initial stage of multispectral data processing in Pix4Dfields involves importing the imagery, configuring the processing parameters, and verifying the quality and completeness of the dataset. Appropriate preparation is essential for generating reliable orthomosaics and spectral index maps, which can subsequently support crop health monitoring and decision-making in precision agriculture.
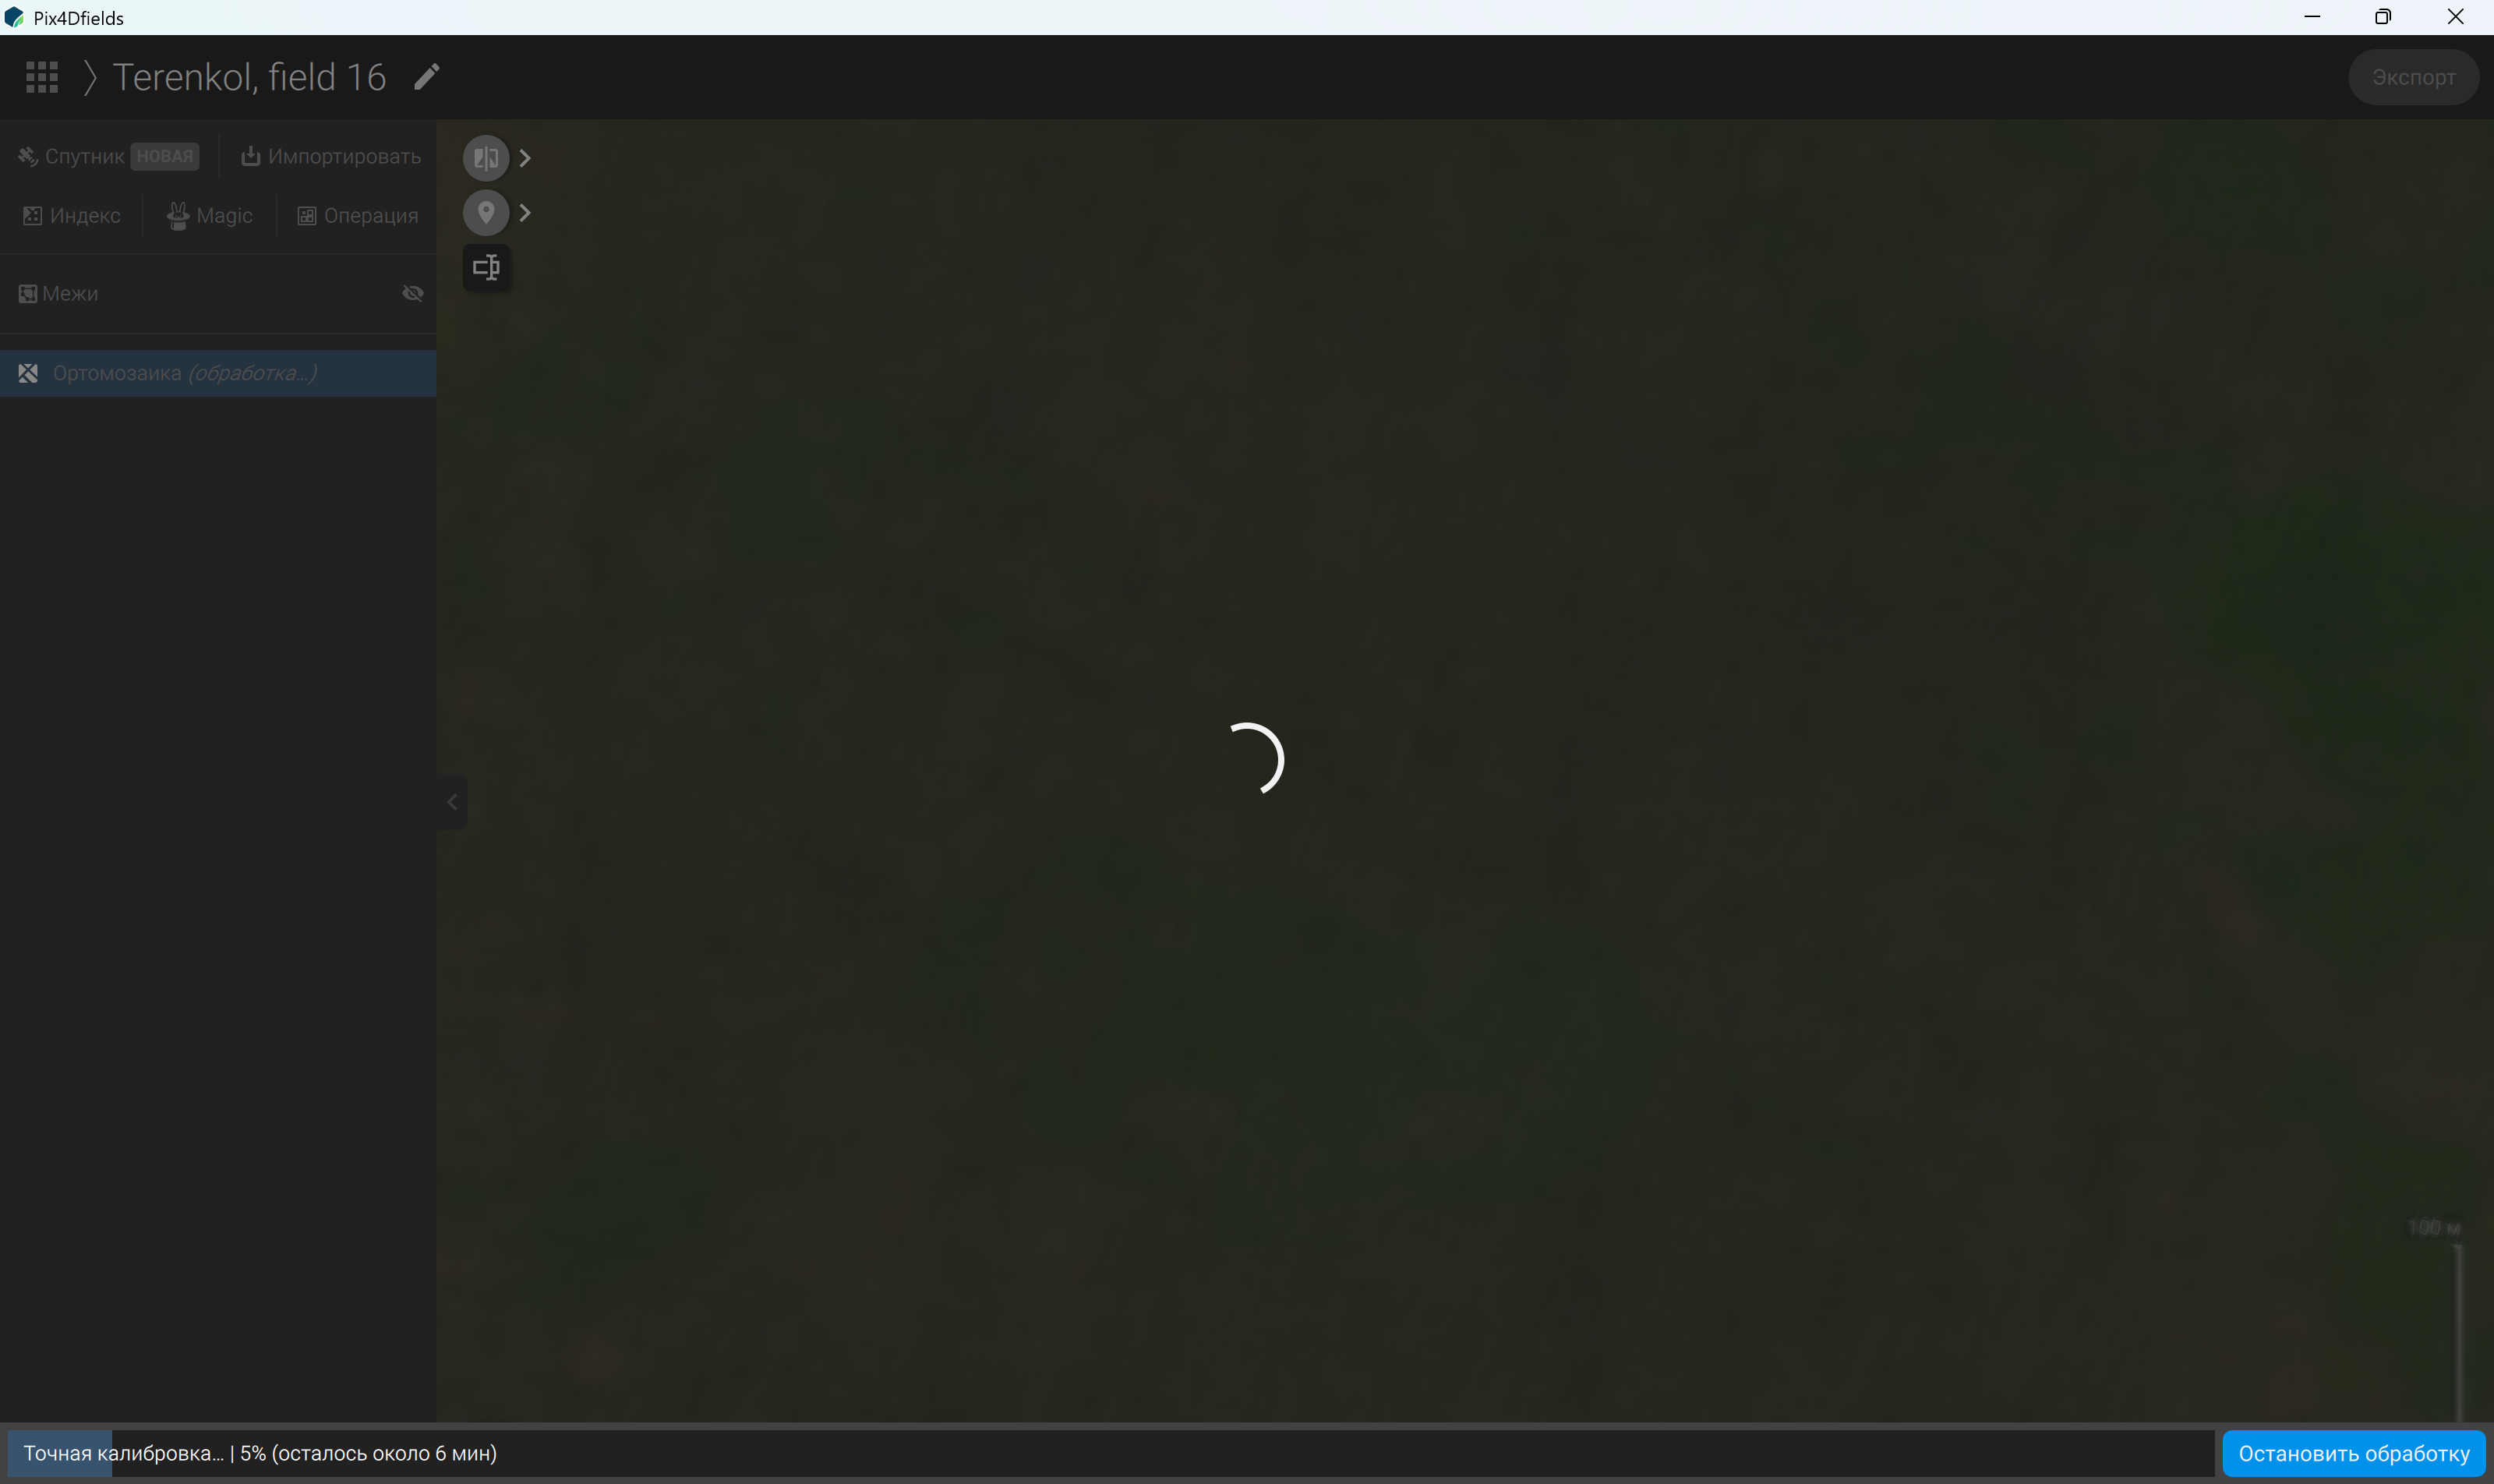
Figure 53 – Processing imported multispectral images